A phase diagram can be defined as a plot of the composition of phases as a function of temperature in any alloy system under equilibrium conditions.
TYPES OF EQUILIBRIUM PHASE DIAGRAMS
✓ A phase diagram can be defined as a plot of the composition of phases as a function of temperature in any alloy system under equilibrium conditions.
✓ The phase diagrams can be broadly classified into two groups. They are:
1. Phase diagrams for complete solid solubility (i.e., phase diagrams for two metals completely soluble in the liquid and solid states).
2. Phase diagrams for partial solid solubility (i.e., phase diagrams for two metals that are partially soluble in one another)
3. Phase diagrams containing three-phase reactions.
1. Phase Diagram For Completely Soluble Metals
(Two metals completely soluble in the liquid and solid states)
(Phase diagram for binary isomorphous alloy systems)
✓ A mixture of two metals is called a binary alloy.
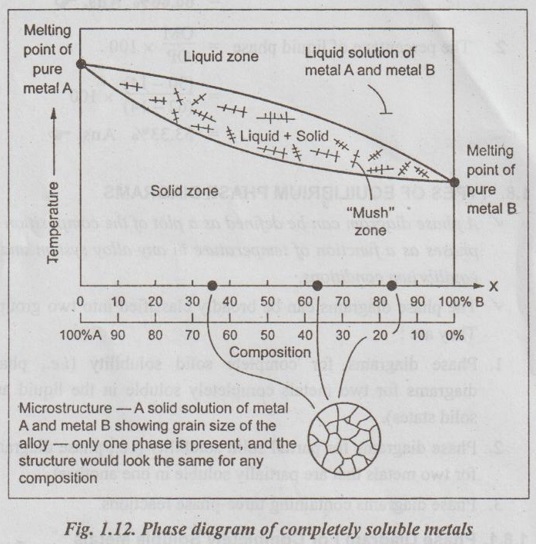
✓ In some binary alloy systems, the two elements are completely soluble in each other in both the liquid and solid states. In these systems only a single type of crystal structure exists for all compositions of the components, and therefore they are called isomorphous systems.
✓ The equilibrium phase diagram for the isomorphous system is shown in Fig.1.12.
✓ The common examples of isomorphous systems are:
1. Copper-Nickel (Cu-Ni) system,
2. Antimony - Bismuth (Sb-Bi) system (Fig. 1.11),
3. Gold-Silver (Au-Ag) system,
4. Cromium - Molybdenum (Cr-Mo) system,
5. Tungsten - Molybdenum (W - Mo) system, and
6. Copper - Gold (Cu - Au) system.
✔ The phase diagram is divided into three separate areas by two phase boundaries namely the liquidus and solidus.
✔ Above the liquidus there is a uniform liquid solution, while below the solidus, there is a single solid solution. Between the liquidus and solidus, both liquid and solid solutions coexist.
✔ Unlike pure metals, alloys freeze over a range of temperature and that the region between the liquidus and solidus curves represents the temperature interval during which the alloys are in a pasty condition.
2. Phase Diagram For Partial Solid Solubility
(Phase diagrams for binary eutectic alloy systems)
✔ As we know, many materials exhibit partial solid solubility (i.e., materials exhibit neither complete solubility nor complete insolubility in the solid state).
✔ Each element is soluble in the other element up to a certain limit or saturation point. The value of this limit is a function of temperature.
✔ If the two metals A and B are not completely soluble through all ranges in composition, then second phase will form at grain boundaries.
✔ The equilibrium phase diagram for an alloy of the two elements A and B that exhibits partial solubility is shown in Fig.1.13.
✔ The common examples of this system include:
1. Copper-Silver (Cu-Ag) system,
2. Lead-Tin (Pb-Sn) system, and
3. Aluminium-Copper (Al-Cu) system.
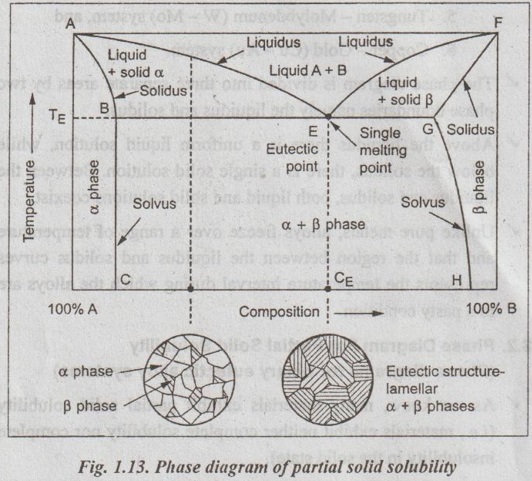
✓ First of all, six phase regions/fields are found on the diagram:
1. Liquid phase,
2. α solid solution phase,
3. β solid solution phase,
4. α solid + liquid phase,
5. β solid + liquid phase, and
6. α + β solid solutions phase.
✓ The α phase is a solid solution in which elements of metal A (solvent) is more than that of metal B (solute). The β phase is a solid solution in which elements of metal B (solvent) is more than that of metal A (solute). Technically, pure metals A and B are considered to be α and β phases respectively.
✔ In Fig. 1.13, the line AEF is known as liquidus line. Liquidus line is the line or boundary that separates liquid and liquid + solid phase regions.
✔ In Fig.1.13, the line ABEGF is known as solidus line. Solidus Sutline is the line or boundary that separates solid an solid + liquid phase regions.
✔ In Fig. 1.13, the lines BC and GH are known as solvus lines. Solvus lines separate single-phase solid regions from two-phase solid regions. The solvus lines BC and GH also denote the maximum solubility limits of metal A in B and of metal B in A respectively.
✔ The introduction of metal B decreases the melting temperature of metal A along the liquidus line AE. Similarly the addition of metal A decreases the melting temperature of metal B along the baud liquidus line FE. These two liquidus lines melt at the point E on the phase diagram. This point E is known as eutectic↑ point.
✔ The corresponding temperature (TE) and composition (CE) in the phase diagram are known as eutectic temperature and eutectic composition respectively.
✔ In other words, eutectic temperature is the minimum temperature at which a binary system is fully melted.
✔ It can also be noted that the horizontal isotherm line BEG also passes through the point E. This horizontal solidus line at TE is called the eutectic isotherm.
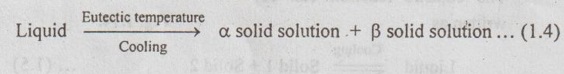
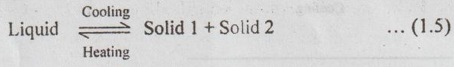
✔ When liquid of eutectic composition is slowly cooled to the eutectic temperature, the single liquid phase transforms simultaneously into two solid forms (solid solutions α and β). This transformation is known as the eutectic reaction.
The eutectic reaction can be written as
†The Greek word eutectic means easily melted.
✔ The eutectic reaction is also called an invariant reaction since it occurs under equilibrium conditions at a specific temperature and alloy composition that cannot be varied.
✓ During the progress of the eutectic reaction, the liquid phase is in equilibrium with the two solid solutions α and β. Thus during a eutectic reaction, three phases coexist and are in equilibrium.
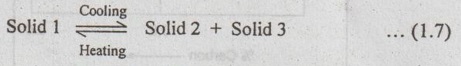
3. Phase Diagrams Containing Three-Phase Reactions
(Some important reactions pertaining to phase transformation)
There are many types of reaction that occur in binary equilibrium phase diagrams. Some of the important reactions that are found generally in different phase diagrams are:
1. Eutectic reaction,
2. Peritectic reaction,
3. Eutectoid reaction, and
4. Peritectoid reaction.
Like eutectic reaction, all the other reactions are also invariant reactions. Invariant means that there are zero degrees of freedom. That is, the reaction occurs with a fixed composition at a fixed temperature.
1. Eutectic Reaction
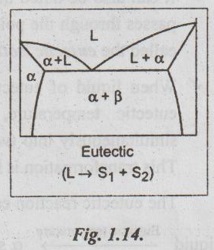
✓ As discussed in the previous section, eutectic reaction is the reversible, isothermal reaction of a liquid which transforms two different solid phases upon cooling.
✓ The eutectic reaction can be written as
✓ Eutectics are found in many metallic and ceramic systems.
✓ Fig.1.14 shows a typical eutectic diagram.
✓ Illustration: The eutectic portion of the iron-carbon equilibrium phase diagram is shown in Fig.1.15. Here the liquid phase on cooling results in the formation of fine mixture of two solids namely
(i) Austenite or γ iron (solid solution of carbon in iron), and
(ii) Cementite (Fe3C).
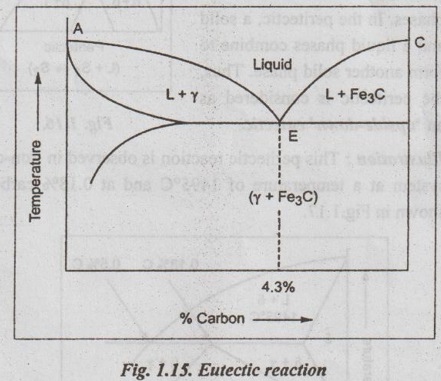
Thus the eutectic reaction in the iron-carbon (Fe-C) system can be written as
2. Peritectic Reaction
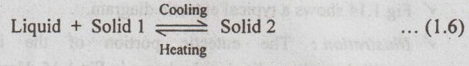
✔ In peritectic reaction, upon cooling, a solid and a liquid phase transform isothermally and reversibly to a solid phase having a different composition.
✔ The peritectic reaction can be written as
✔ Peritectic reaction is found in Sb-Sn and Pt-Ag systems.
✔ Fig.1.16 shows a typical peritectic reaction diagram.
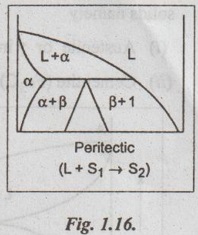
✔ In the eutectic, the liquid transforms into two solid phases. In the peritectic, a solid and a liquid phases combine to form another solid phase. Thus, the peritectic is considered as an 'upside-down' eutectic.
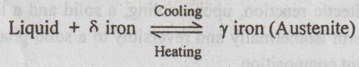
✔ Illustration: This peritectic reaction is observed in iron-carbon system at a temperature of 1495°C and at 0.18% carbon, as shown in Fig.1.17.
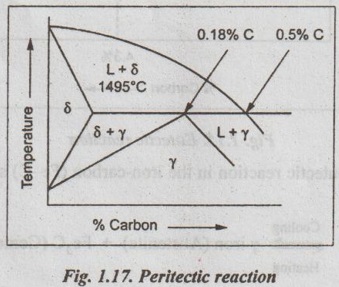
Thus the peritectic reaction in the Fe-C system can be written as
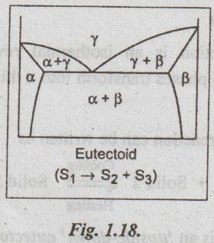
3. Eutectoid Reaction
✓ Unlike eutectic and peritectic transformations (which are liquid-solid transformations), eutectoid involves a solid-solid transformation.
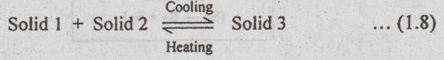
✓ Eutectoid reaction is an isothermal reversible reaction in which one solid phase transforms into two intimately mixed new solid phases, upon cooling.
✓ The eutectoid reaction can be written as
✓ Eutectoid reaction is found in many systems such as Cu-Al, Cu-Zn, Cu-Sn, Al-Mn, Cu-Be, and so on.
✓ A eutectoid is shown schematically in Fig.1.18.
✓ This reaction is the basis for much of the heat treating of steel and its variety of applications.
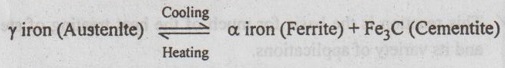
✔ Illustration: The eutectoid reaction is observed in Fe-C system, as shown in Fig. 1.19. Here when austenite (γ iron) is cooled below a temperature of 723°C, it transforms itself into a mixture of ferrite (solid solution of carbon in α iron) and cementite (Fe3C).
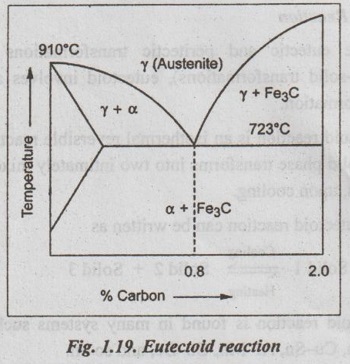
Thus the eutectoid reaction in the Fe-C system can be written as
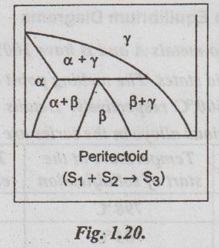
4. Peritectoid Reaction
✓ Peritectoid reaction is an isothermal reversible reaction in which two solid phases transform into a third solid phase, upon cooling.
✓ The peritectoid reaction can be written as
✓ The peritectoid is an 'upside-down' eutectoid.
✓ Peritectoid systems are found in Ni-Zn, Fe-Nb, Cu-Sn, Ni-Mo, and many other systems.
✓ A peritectoid is shown schematically in Fig. 1.20.
Summary of Invariant Reactions
The various invariant reactions are summarised in Table 1.1.
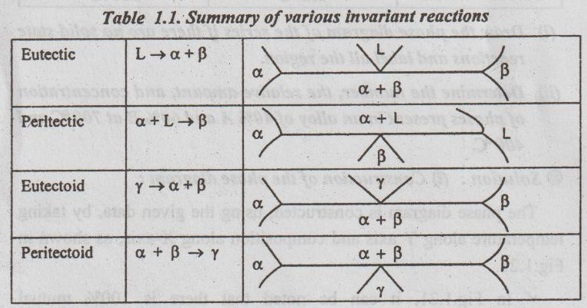
L indicates a liquid phase.
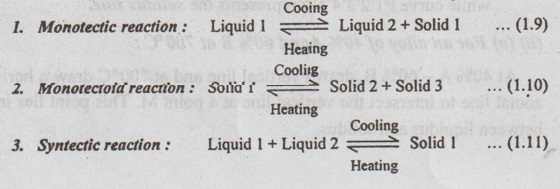
Note
In addition to the above three phase reactions, there are three more reactions exist in phase diagrams. They are given below:
4. Problems on Equilibrium Diagrams
Example 1.3
Two metals A and B have 100% mutual solubilities in the liquid and solid states. The melting point of pure metals A and B are 800 °C and 600 °C respectively. Details of start and end of solidifications of various alloys in the series are as follows:
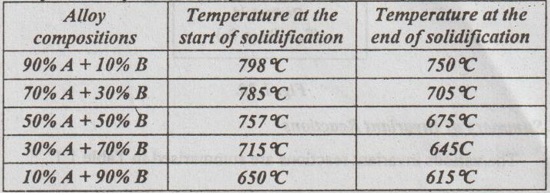
(i) Draw the phase diagram of the series if there are no solid state reactions and label all the region.
(ii) Determine the number, the relative amount, and concentration of phases present in an alloy of 40% A and 60% B at 700 °C and 400 °C.
● Solution:
(i) Construction of the phase diagram:
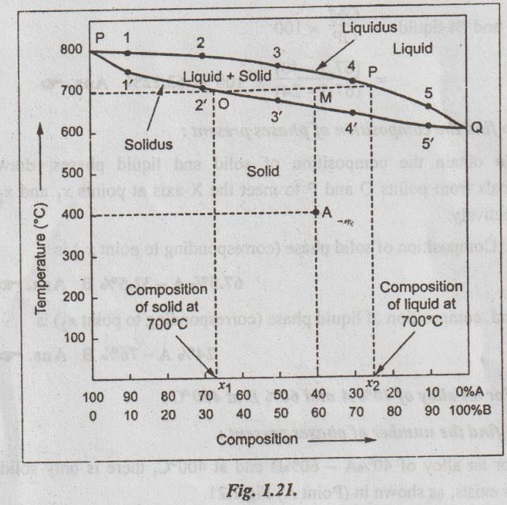
The phase diagram is constructed, using the given data, by taking temperature along Y axis and composition along X-axis, as shown in Fig. 1.21.
✓ In Fig.1.21, it can be noted that there is 100% mutual solubilities of metal A and B both in liquid and solid phases.
✓ Also in Fig.1.21, curve P12345Q represents the liquidus line while curve P1'2'3'4'5'Q represents the solidus line.
(ii) (a) For an alloy of 40% A and 60% B at 700 °C:
At 40% A - 60% B, draw a vertical line and at 700°C draw a hori- zontal line to intersect the vertical line at a point M. This point lies in between liquidus and solidus.
1. To find the number of phases present:
At 40% A-60% B,
the number of phases, P = 2 (Liquid + Solid) Ans.![]()
2. To find the relative amount of phases present:
The relative amounts of liquid and solid is obtained by using the Lever's rule. Through point M, draw a horizontal to cut the solidus line at point O and liquidus line at point P.
Applying the Lever's rule, we get
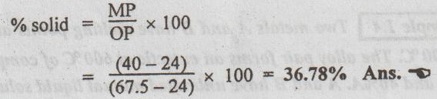
3. To find the composition of phases present:
To obtain the composition of solid and liquid phases, draw verticals from points O and P to meet the X-axis at points x1 and x2 respectively.
⸫ Composition of solid phase (corresponding to point x1) is
67.5% A-32.5% B Ans.![]()
and composition of liquid phase (corresponding to point x2) is
24% A-76% B Ans.![]()
(b) For an alloy of 40% A and 60% B at 400 °C:
1. To find the number of phases present:
For an alloy of 40%A - 60%B and at 400°C, there is only solid phase exists, as shown in (Point A) Fig. 1.21.
⸫ Number of phases present, P = 1 (solid phase) Ans.![]()
2. To find the relative amount of phases present:
Since only one phase is present, the relative amount of phases present = 100% Ans.![]()
3. To find the composition of phases present:
As we know, when only one phase is present in the alloy, the composition of the phase equals the overall composition of the alloy.
⸫ Composition of the solid phase is 40%A-60%B Ans.![]()
Example 1.4
Two metals A and B have melting points at 900 °C and 800 °C. The alloy pair forms an eutectic at 600°C of composition 60%B and 40%A. A and B have unlimited mutual liquid solubilities.
Their solid solubilities are as follows: 10%B in A at 600°C and 5%B in A at 0°C, 12% A in B at 600 °C and 4% A in B at 0°C. Assume liquidus, solidus, and solvus lines to be straight; no solid state reactions other than solubility changes occur in the series.
(i) Draw the phase diagram for series and label all the temperatures, compositions, and fields.
(ii) Find the number, type, extent, and composition of the phases present in an alloy of composition 60%A and 40%B at 200°C.
● Solution:
(i) Construction of the phase diagram:
The phase diagram is constructed for the given series of data, as shown in Fig.1.22.
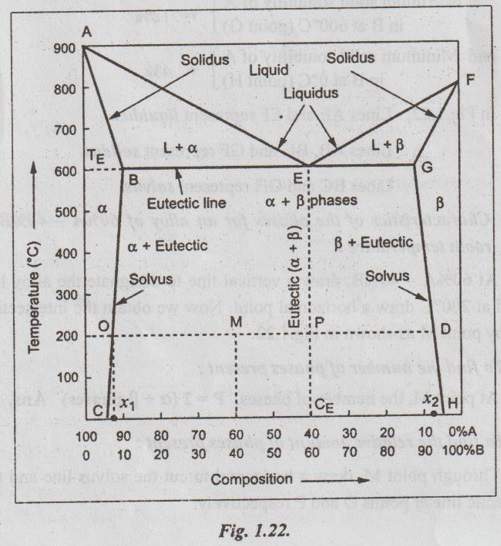
From Fig.1.22, one can verify the following characteristics of the alloy :
Melting point of metal A (point A) = 900°C
Melting point of metal B (point F) = 800°C
Eutectic temperature (point TE) = 600°C
Eutectic composition (point CE) = 40%A - 60%B
Maximum solid solubility of B in A at 600°C (point B) = 10%
Minimum solid solubility of B in A at 0°C (point C) = 5%
Maximum solid solubility of A in B at 600°C (point G) = 12%
and Minimum solid solubility of A in B at 0°C (point H) = 4%
In Fig. 1.22, Lines AE and EF represent liquidus.
Lines AB, BG and GF represent solidus.
Lines BC and GH represent solvus.
(ii) Characteristics of the phases for an alloy of 60%A - 40%B at room temperature:
At 60%A - 40%B, draw a vertical line to designate the alloy line and at 200°C draw a horizontal point. Now we obtain the intersection alloy point M as shown in Fig. 1.22.
1. To find the number of phases present:
At point M, the number of phases, P = 2 (α + β phases) Ans.
2. To find the relative amount of phases present:
Through point M, draw a horizontal to cut the solvus line and the eutectic line at points O and P respectively.
Now applying the Lever's rule, we get
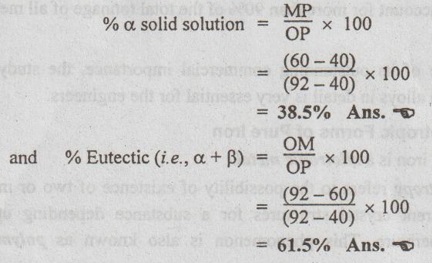
3. To find the composition of phases present:
To obtain the composition of α and β solid phases, draw verticals from points O and P to meet the X-axis at points x1 and x2 respectively.
⸫ Composition of a solid phase (corresponding to point x1) is 92%A8%B Ans.![]()
and Composition of β solid phase (corresponding to point x2) is 8%A-92%B Ans.![]()
No comments:
Post a Comment