It should be understood that the iron-iron carbide equilibrium Lorian diagram (refer Section 1.11) shows the phases and the resulting microstructures corresponding to equilibrium conditions only.
TTT AND CCT DIAGRAMS
ISOTHERMAL TRANSFORMATION DIAGRAMS (TTT DIAGRAMS)
1. Introduction
✓ It should be understood that the iron-iron carbide equilibrium Lorian diagram (refer Section 1.11) shows the phases and the resulting microstructures corresponding to equilibrium conditions only. Basically ferrite, cementite, pearlite and austenite are equilibrium phases. That why the selection of temperatures of heat treating processes such as full annealing, stress relief annealing, recrystallisation annealing, spheroidizing, and normalising is made based on the iron-iron carbide equilibrium diagram.
✓ The phases martensite and bainite are non-equilibrium phases that do not appear in the Fe-Fe3C phase diagram. Also many strengthening treatments such as hardening and tempering are non-equilibrium in nature. For these non-equilibrium transformation processes, the Fe-Fe3C phase diagram cannot be applied. In order to show the influence of varying cooling rates, that is time, on the transformation of austenite other types of diagram are necessary. These are the time-temperature-transformation or T-T-T diagram and the continuous-cooling- transformation or C-C-T diagrams.
2. Difference Between Fe-Fe3C Equilibrium Diagram and TTT Diagram
✓ The Fe-Fe3C equilibrium diagram is useful for showing the phases and the resulting microstructures under the equilibrium conditions only. But TTT and CCT diagrams are used for oprostudying non-equilibrium phase transformations.
✓ An individual equilibrium diagram covers an entire alloy system of various compositions. But a TTT diagram or a CCT diagram applies only to one steel of a specified composition.
3. Time-Temperature-Transformation (or TTT) Diagrams
✓ The time-temperature-transformation (TTT) diagram, which is also called the isothermal transformation (IT) diagram, is a tool used by heat treaters to predict quenching reactions in steels.
✓ Because of the shape, the TTT diagrams are also called S curves or C curves. Sometimes TTT diagram is also known as Bain's curve.
✓ The TTT diagram is a plot of temperature versus the logarithm of time for a steel alloy of definite composition.
✓ The TTT diagram assumes that the temperature is constant (i.e., isothermal) during the transformation.
✓ The TTT diagram is used to determine when transformations begin and end for an isothermal↑↑ heat treatment of a previously austenitized alloy..
4. Construction of a TTT Diagram
The step by step procedure for constructing a TTT diagram is as follows:
Step 1: Obtain a large number of relatively small specimens of same material.
Step 2: Austenitize the samples in a furnace at a temperature above the eutectoid temperature, as shown in Fig.2.14 (a).
† A logarithm scale is used on the horizontal axis of the TTT diagram in order to compress the right-hand end of the diagram, at the same time without cramping the important left-hand side. amit
†† Isothermal transformation means the transformation that is allowed to occur at constant temperature.
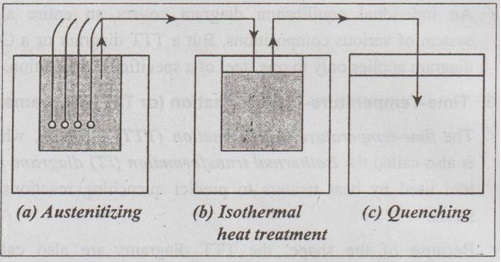
Fig. 2.14. Experimental arrangement for determining the microscopic changes that occur during the isothermal transformation of austenite in a eutectoid plain-carbon steel
Step 3: Then quench i.e., rapidly cool the samples in a liquid salt bath at the desired temperature below the eutectoid temperature, as shown in Fig.2.14 (b).
Step 4: After various time intervals, remove the samples from the salt bath one at a time and quench into water at room temperature, as shown in Fig.2.14 (c). ́
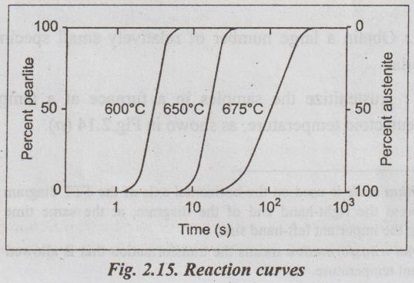
Step 5: Now, examine the microstructure after each transtor- mation time at room temperature. The result obtained is the reaction curve as shown in Fig.2.15.
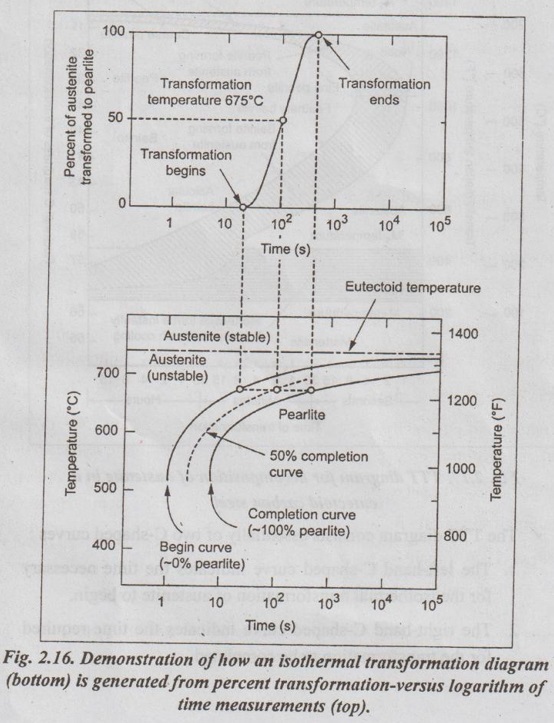
Step 6: Now repeat the above procedure for the isothermal transformation at progressively lower temperatures. The data obtained from a series of isothermal reaction curves over the whole temperature range of austenite instability for a given composition of steel is summarised, the result is TTT diagram for that steel, as shown in Fig.2.16.
5. TTT Diagram for a Eutectoid Steel
✓ Fig.2.17 depicts a simplified version of the TTT diagram for 0.8% (eutectoid) carbon steel.
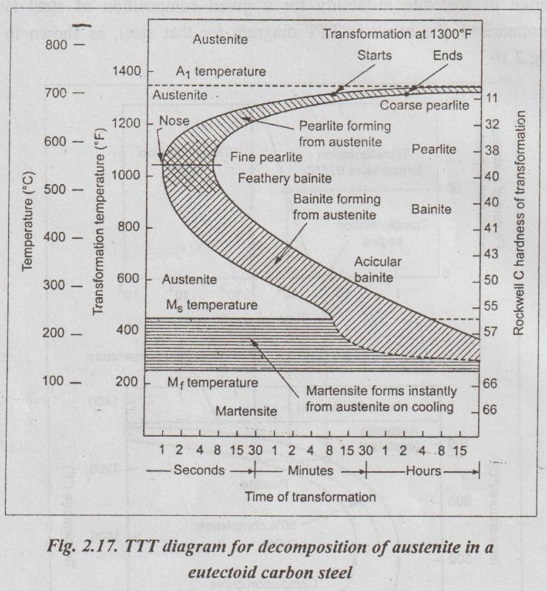
✓ The TTT diagram consists essentially of two C-shaped curves :
1. The left-hand C-shaped curve indicates the time necessary for the isothermal transformation of austenite to begin.
2. The right-hand C-shaped curve indicates the time required for the transformation to be completed.
✓ Two parallel lines near the foot of the diagram are, strictly speaking, not part of the TTT diagram. But these two parallel lines indicate the temperatures where austenite will start to transform to martensite (Ms) and where this transformation will finish (Mf).
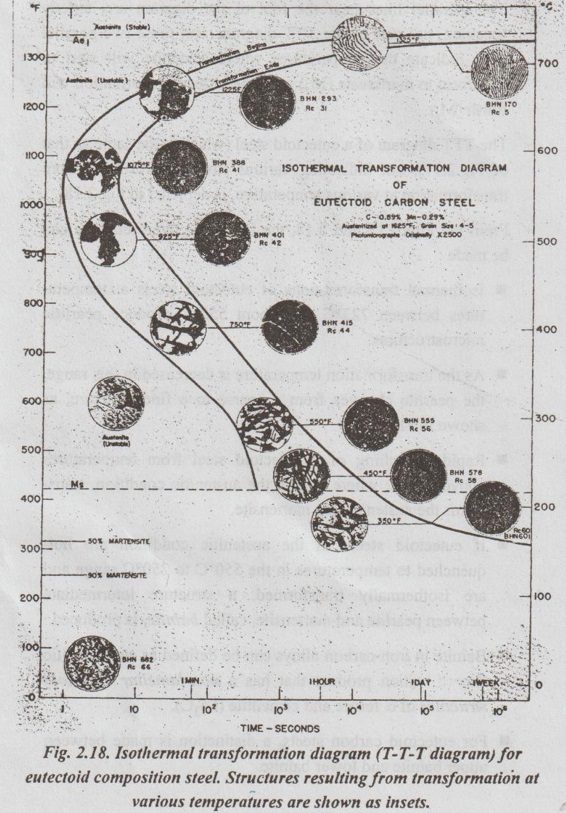
✓ The TTT diagram of a eutectoid steel (which is the same as that of Fig.2.17), but indicating various structures resulting from transformation at various temperature, is depicted in Fig.2.18.
✓ From the Figs.2.17 and 2.18, the following interpretations can be made :
■ Isothermal transformations of eutectoid steels at temperatures between 723°C and about 550°C produce pearlitic microstructures.
■ As the transformation temperature is decreased in this range, the pearlite changes from a coarse to a fine structure, as shown in Fig.2.18.
■ Rapid quenching of a eutectoid steel from temperatures above 723°C, where it is in the austenitic condition, trans- forms the austenite into martensite.
■ If eutectoid steels in the austenitic condition are hot- quenched to temperatures in the 550°C to 250°C range and are isothermally transformed, a structure intermediate between pearlite and martensite, called bainite, is produced.
■ Bainite in iron-carbon alloys can be defined as an austenitic decompoşition product that has a non-lamellar eutectoid structure of a ferrite and cementite (Fe3C).
■ For eutectoid carbon steels, a distinction is made between upper bainite and lower bainite.
(i) Upper bainite is formed by isothermal transformation at temperatures between 550°C and 350°C. Upper bainite has large, rod like cementite regions.
(ii) Lower bainite is formed between about 350°C and 250°C. Lower bainite has much finer cementite particles.
■ As the transformation temperature is decreased, the carbon atoms cannot diffuse as easily. Hence the lower bainite structure has smaller particles of cementite.
6. Significance of TTT Diagram in the Heat Treatment of Steel
✓ The TTT diagram is most useful in giving an overall picture of the transformation behaviour of austenite. This enables the metallurgist to interpret the response of a steel to any specified heat treatment.
✓ Using a TTT diagram, one can plan practical heat treatment operations to get desirable microconstituents, to control limited hardening or softening, and the time of soaking.
No comments:
Post a Comment