Using a phase diagram, one can obtain at least the following three informations.
INTERPRETATION OF PHASE DIAGRAMS
(Utilisation of Phase Diagrams)
Using a phase diagram, one can obtain at least the following three informations.
1. The phases that are present,
2. The composition of each phase, and
3. The amount of each phase present.
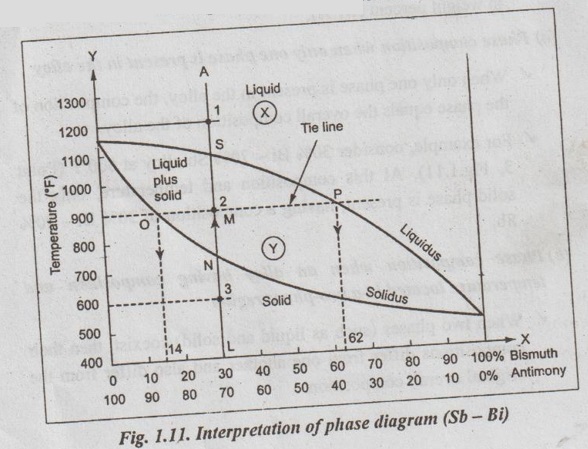
Now let us consider the equilibrium diagram shown in Fig.1.11 of two metals (Sb - Bi) that are completely soluble in each other in both the liquid and solid states. For the Fig.1.11, let us discuss the procedure for determining the above three informations.
1. Determination of Phases Present
✓ By simply locating the temperature - composition point on the phase diagram and identifying the region of the diagram in which it appears, one can determine the stable phases.
✓ Illustration: In the phase diagram (Fig.1.11):
■ Point 1: With 30% Bi-70% Sb alloy at 1200°F, only the single liquid phase is present.
■ Point 2: With 30% Bi - 70% Sb alloy at 900°F, both liquid and solid phases are present.
■ Point 3: With 30% Bi - 70% Sb allow at 600°F, only the single solid phase is present.
2. Determination of Phase Composition
✓ Each phase has a composition, expressed as the percentage of each element in the phase. Usually the composition is expressed in weight percent (wt %).
(a) Phase composition when only one phase is present in the alloy
✓ When only one phase is present in the alloy, the composition of the phase equals the overall composition of the alloy.
✓ For example, consider 30% Bi - 70% Sb alloy at 600°F (Point 3, Fig.1.11). At this composition and temperature, only the solid phase is present, having a composition of 30% Bi - 70% Sb.
(b) Phase composition when an alloy having composition and temperature located in a two-phase region
✓ When two phases (such as liquid and solid) coexist, then their compositions differ from one another and also differ from the vnom original overall composition.
✓ Procedure to compute the equilibrium compositions of the two phases:
1. Construct a tie line across the two-phase region at the temperature of the alloy. A tie line is simply an isothermal line. drawn through the point of consideration, extending across the two-phase region and terminating at the phase boundary lines on either side.
2. Note down the intersections of the tie line and the phase boundaries on either side.
3. Draw the perpendiculars from these intersections to the Job horizontal composition axis. Now read the composition of the each of the respective phases from the perpendiculars.
✓ Illustration: Consider again the 30% Bi - 70% Sn at 900°C, located at point 2 in Fig.1.11. To find out the composition for both liquid and solid phases, draw a horizontal tie line OP across the two-phase region, as shown in Fig.1.11. The tie line intersects the phase boundaries at the points O and P.
Now drawing perpendicular from the point O, we get composition of liquid phase as 14% Bi - 86% Sb. Similarly drawing perpendicular from the point P, we get composition of solid phase as 62% Bi-38% Sb.
3. Determination of Phase Amounts
✓ The relative amounts (as fraction or as percentage) of the phases present at equilibrium can also be determined with the Is yolis help of phase diagrams.
(a) Determination of phase amounts in single-phase regions
✓ In single-phase regions, the amount of the single phase is 100%.
✓ Since only one phase is present, the alloy is composed entirely of that phase. That is, the phase fraction is 1.0 or the phase percentage is 100%.
✓ For example, for the 30% Bi - 70% Sb alloy at 600°F, only the solid phase is present. Thus the alloy is completely (100%) in solid phase.
(b) Determination of phase amounts in two-phase regions
✓ The weight percentage of the phases in any two-phase region of the phase diagram can be calculated by using the lever rule.
✓ Lever rule procedure:
1. Construct the tie line across the two-phase region at the temperature of the alloy. The tie line is considered as a lever with the fulcrum of the lever being the original composition of the alloy. The entire tie line represents 100% of overall alloy composition at the temperature of the alloy.
2. Now compute the fraction of one phase by taking the length of the tie line from the overall alloy composition to the phase boundary for the other phase, and dividing by the total tie line length. The lever law in general can be written as,
Phase fraction = Opposite arm of lever / Total length of tie line ….. (1.3)
and
Phase percentage = Opposite arm of lever / Total length of tie line × 100
3. Determine the fraction of other phase in the same manner.
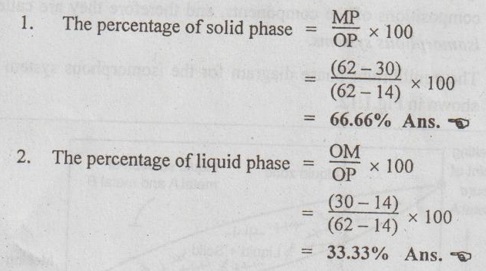
✓ Illustration of level rule: Consider again 30% Bi - 70% Sb alloy at temperature 900°C, located at point 2 in Fig.1.11. The tie line OP is constructed as shown. Let the overall alloy composition be located along the tie line and denoted as M (Fig.1.11). Thus the tie line OP represents the lever, the point M represents the fulcrum, and the lengths OM and MP represent lever arms.
Now applying the lever rule, we get
No comments:
Post a Comment