One of the central themes in materials engineering is that the properties of a material depend on its underlying micro- structure.
PHASE DIAGRAMS
1. Introduction
✓ One of the central themes in materials engineering is that the properties of a material depend on its underlying micro- structure. Also the development of the microstructure of the material depends upon its overall composition as well as variables such as temperature and pressure. As the composition involves more elements, the number of phases that may be present increases. In these situations, phase diagrams provide a biller convenient method for characterising materials as a function of nogu temperature and pressure.
✓ Phase diagrams are graphical representations of what phases are present in a materials system at various temperatures, ni to pressures, and compositions.
✓ In other words, a phase diagram is a map showing the structures or phases present as the temperature and overall composition of the material are varied.
✓ Phase diagrams are also known as equilibrium diagrams or constitutional diagrams.
✓ Thus the phase diagrams show in graphical form, the consti- tution of alloys as a function of temperature under equilibrium conditions.
2. Why Should Phase Diagrams Be Studied?
✓ The phase diagrams can answer the following important questions:
● What condition is the material in ?
● Is the composition uniform throughout? If not, how much of each component is present?
● Is something present that may give undesired properties?
● What will happen if temperature is increased or decreased; pressure is changed; or composition is varied ?
✓ Phase diagrams are used by engineers and scientists to under- stand and to predict many aspects of the behaviour of materials.
3. Information From Phase Diagrams
The phase diagrams are used to obtain the following informations:
1. To show what phases are present at different compositions and temperatures under equilibrium conditions.
2. To indicate the equilibrium solid solubility of one element in another element.
3. To indicate the temperature range over which solidification of a material occurs.
4. To indicate the temperature at which different phases start to melt.
† For more details on how these informations can be obtained from phase diagrams, refer Section 1.7.
Thus phase diagrams are important for the proper understanding of alloy systems. They provide information relating to the heat-treatment processes that are used to modify the structures and properties of alloys.
4. Terminology Used in Phase Diagrams
The various terms used in the study of phase diagrams have been explained below.
1. Component: ✓ Components are pure metals and/or compounds of which an alloy is composed.
✓ Example: In a copper-zinc brass, the components are Cu and Zn.
2. System: ✓ The term system has two meanings in this context.
(i) 'System' may refer to a specific body of material under consideration. For example, a ladle of molten steel is referred as a system.
(ii) 'System' may also refer to .the series of possible alloys consisting of the same components. For example, the iron- carbon system.
✓ A system having one component is called a Unary system, and the systems having two, three and four components are known as Binary, Ternary and Quaternary systems, respectively.
3. Alloy: An alloy is a mixture of two or more metals or a metal (metals) and a non-metal (non-metals).
4. Solid solution: It is a solid that consists of two or more elements atomically dispersed in a single-phase structure.
5. Solute: It is the minor part of the solution or the material which is dissolved.
6. Solvent: The material which contributes the major portion of the solution.
7. Phase: A phase may be defined as a homogeneous portion of a system that has uniform physical and chemical characteristics. For more details, refer Section 1.4.5.
8. Equilibrium: ✓ Equilibrium is said to exist when enough time is allowed for all possible reactions to be completed.
✓ The equilibrium state refers to the characteristics of the system that remain constant indefinitely. Equilibrium occurs when the free energy of the system is at its minimum value.
✓ The term phase equilibrium refers to equilibrium as it applies to systems in which more than one phase may exist.
9. Solubility limit:
✓ It is the maximum concentration of solute that may be added without forming a new phase.
✓ The addition of solution in excess of the solubility limit results in the formation of another solid solution or compound.
10. Degrees of freedom: It is the number of independent variables (such as temperature, pressure, and composition) that can be changed independently without changing the phase or phases of the system.
5. What is Meant by the Term Phase?
✓ A phase may be a portion of matter which is homogeneous.
✓ A phase is defined as any physically distinct, homogeneous, and mechanically separable portion of a substance.
✓ In layman's term, a phase requires a unique structure, uniform composition, and well-defined boundaries or interfaces.
✓ Examples: A pure substance such as water is a single phase.
● The pure substance water can exist in solid, liquid and vapour, each of these states being a single phase, as shown in Fig. 1.7 (a).
● Now consider the effect of adding salt (NaCl) to water. Salt will dissolve in water to give a homogeneous solution. Thus salt-water solution form a single phase, as shown in Fig. 1.7 (b).
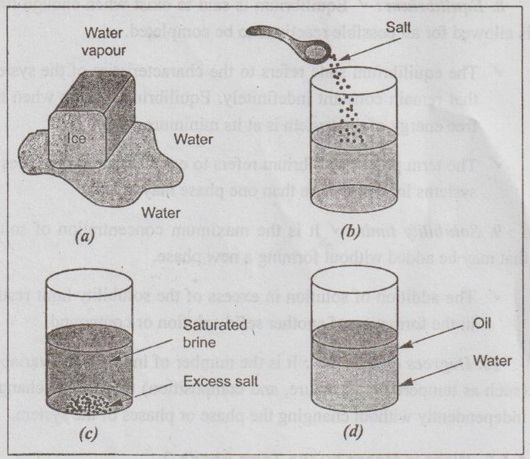
Fig. 1.7. Illustration of phases: (a) The three forms of water - ice, water, and water vapour - are each a phase; (b) Salt and water have unlimited solubility (homogeneous solution) - form a single phase; (c) Salt and water have limited solubility (heterogeneous solution) - form two distinct phases; (d) Oil and water have virtually no solubility - form two distinct phases
● If more salt is added into water, then we have two different phases, as shown in Fig. 1.7 (c). One phase is a fully bos bupil saturated solution of salt in water, and the second phase is the excess undissolved water.
● Oil and water tend to form isolated regions and are considered as two distinct phases, as shown in Fig.1.7 (d).
✓ A single-phase system is also termed as 'homogeneous system'.
✓ Systems composed of two or more phases are termed as 'mixtures' or 'heterogeneous systems'. Most metallic alloys, ceramics, polymers, and composites are heterogeneous.
6. Phase Diagram of Pure Substance (One-component phase diagram)
✓ A pure substance such as water can exist in solid, liquid, or vapour phases, depending on the conditions of temperature and pressure.
✓ The phase relationships may be represented on a pressure- temperature (PT) diagram. Fig.1.8 shows such a pressure- temperature phase diagram, known as a one-component (or unary) phase diagram, for the H2O system.
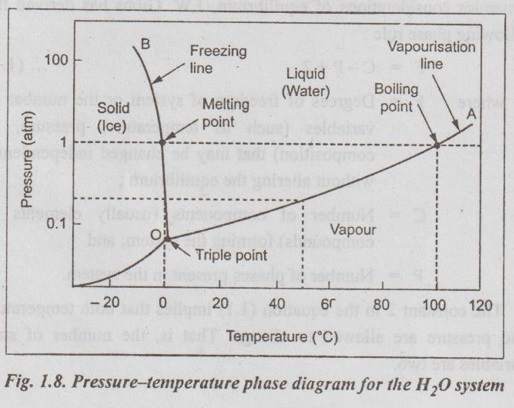
✓ The phase diagram is composed of regions of pressure and temperature where only a single phase is stable.
✓ In Fig. 1.8, the line OA indicates the vapourisation line and the line OB indicates the freezing line. Liquid and vapour phases exist along the vapourisation line and liquid and solid phases along the freezing line, as shown in Fig. 1.8. These lines are also known as two-phase equilibrium lines.
✓ The point 'O' in Fig. 1.8 is known as a triple point. Triple point is the point at which three phases (solid, liquid, and vapour phases) of a single material coexist. Thus triple point of water exists at temperature 0.0098°C and at pressure 4.58 mm of Hg.
✓ It can be noted that if pressure and temperature are known, the equilibrium of the system can be found.
7. Gibb's Phase Rule
The number of phases present in any alloy depends upon the number of elements of which the alloy is composed. From thermo- dynamics considerations of equilibrium, J.W. Gibbs has derived the following phase rule:
F = C - P + 2 ... (1.1)
where
F = Degrees of freedom of system or the number of variables (such as temperature, pressure, or composition) that may be changed independently without altering the equilibrium;
C = Number of components (usually elements or compounds) forming the system; and
P = Number of phases present in the system.
The constant 2 in the equation (1.1) implies that both temperature and pressure are allowed to change. That is, the number of state variables are two.
Uses of Phase Rule
✓ The phase rule predicts maximum number of phases present in the alloy under equilibrium conditions at any point of diagram.
✓ If number of phases are known, one can determine the degrees of freedom using the phase rule.
✓ Thus the phase rule is useful to know whether the temperature or pressure or both variables can be changed without changing the structure of the alloy.
8. Illustrations of the Use of the Phase Rule
Let us consider the application of Gibbs phase rule to the phase diagram of water system (Fig.1.8).
Case 1: Consider a triple point in Fig.1.8. At the triple point, three phases coexist in equilibrium, ⸫ P = 3. Since there is one component (water) in the system, ⸫ C = 1.
Then the number of degrees of freedom can be calculated using the Gibbs phase rule as,
F = 1 - 3 + 2
or
F = 0 (zero degree of freedom)
This means that none of the variables (temperature or pressure) can be changed at the triple point.
Note
Since the variables temperature or pressure cannot be changed and still keep the three phases of coexistence, the triple point is called an invariant point.
Case 2: Next consider a point along the liquid-solid freezing curve of Fig.1.8. It can be seen that at any point along this line two phases will coexist, ⸫ P = 2. Then for water system, C = 1.
Applying the phase rule, we get
F = 1 - 2 + 21
or
F = 1 (one degree of freedom)
This means that one variable (temperature or pressure) can be changed independently and still maintain a system with two coexisting phases.
Case 3: Now consider a point on the phase diagram of water inside a single phase, as shown in Fig.1.8. In this case, there will be only one phase present, ⸫ P = 1. Then for water system, C = 1.
Now the phase rule gives
F = 1 - 1 + 2
or
F = 2 (two degrees of freedom)
This means that two variables (temperature and pressure) can be varied independently and the system will still remain a single phase.
Note
In many applications (especially for most binary alloys↑), the pressure is kept constant at 1 atmosphere. In this case, the Gibbs phase rule is modified as
F = C - P + 1 ….(1.2)
The above equation is also known as condensed phase rule. This equation can be applied to most of the binary phase diagrams.
Example 1.1
Determine the number of phases, components, and degrees of freedom of the following systems:
(i) Water in a beaker.
(ii) Sodium chloride and water.
(iii) A mixture of nitrogen and hydrogen gases in a vessel.
(iv) Water (liquid) - water vapour.
(v) Water (liquid) - water vapour at 1 atmosphere pressure.
● Solution:
(i) For water system in a beaker:
Number of phases, P = 2 (liquid and vapour)
Number of components, C = 1 (water)
† A mixture of two metals is called a binary alloy.
⸫ Degrees of freedom; F = C - P + 2
F = 1 - 2 + 2 = 1
(one degree of freedom)
(ii) For sodium chloride and water system:
Number of phases, P = 2 (liquid and vapour)
Number of components, C = 2 (NaCl and water)
⸫ Degrees of freedom, F = C - P + 2
F = 2 - 2 + 2 = 2
(two degrees of freedom)
(iii) For N2-H2 gas system:
Number of phases, P = 1 (gas)
Number of components, C = 2 (N2 and H2)
⸫ Degrees of freedom, F = 2 - 1 + 2 = 3
(three degrees of freedom).
(iv) For water (liquid) - water vapour system:
Number of phases, P 2. (liquid and vapour)
Number of components, C = 1 (water)
⸫ Degrees of freedom, F = 1 - 2 + 2 = 1
(one degree of freedom)
(v) For water (liquid) - water vapour system at 1 atmosphere pressure:
Number of phases, P = 2 (liquid and vapour)
Number of components, C = 1 (water)
⸫ Degrees of freedom, F = C - P + 1
(⸪ using condensed phase rule)
= 1 - 2 + 1
= 0 (zero degree of freedom)
Example 1.2
Calculate the degrees of freedom at a constant pressure of 1 atm for: (a) a single-phase solid solution of tin (Sn) dissolved in the solvent lead (Pb); (b) pure Pb below its melting point; and (c) pure Pb at its melting point.
● Solution:
For a constant pressure of 1 atm, the Gibb's modified phase rule is given by,
F = C - P + 1
(a) Degrees of freedom for a single-phase solid solution of Sn-Pb:
Number of phases, P = 1 (single-phase solid solution)
Number of components, C = 2 (Sn and Pb)
⸫ Degrees of freedom, F = 2 - 1 + 1 = 2
(two degrees of freedom)
(b) Degrees of freedom for a pure Pb below its melting point:
Number of phases, P = 1 (solid)
Number of components, C = 1 (Pb)
⸫ Degrees of freedom, F = 1 - 1 + 1 = 1
(one degree of freedom)
(c) Degrees of freedom for a pure Pb at its melting point:
Number of phases, P = 2 (solid and liquid)
Number of components, C = 1 (Pb)
⸫ Degrees of freedom, F = 1 - 2 + 1 = 0
(zero degree of freedom)
No comments:
Post a Comment