1.1 Fundamental Analysis: An Introduction
Fundamental analysis (FA) is a method of measuring a security's intrinsic value by examining related economic and financial factors. Fundamental analysts study anything that can affect the security's value, from macroeconomic factors such as the state of the economy and industry conditions to microeconomic factors like the effectiveness of the company's management.
The outcome of fundamental analysis is a value (or a range of values) of the stock of the company called its 'intrinsic value' (often called 'price target' in fundamental analysts' parlance). It is based on the premise that in the long run true or fair value of an equity share is equal to its intrinsic value.
The intrinsic value of an asset is the present value of all expected future cash inflows (or earnings) from that asset. In case of an equity share it will be equal to the present value all expected future earnings (in the form of dividend, capital gain etc.) from that share because equity shares have infinite life.
The expected earnings from an equity share depend upon a variety of economy wide, industry wide and company specific factors. Therefore fundamental analysis involves in-depth analysis of all possible factors having a bearing on company's profitability and future prospects and hence on share price (theoretical or fair price).
Investors would purchase the stock if intrinsic value is above the current market price
If the intrinsic value of a stock is below the market price the investor would sell the stock because he believes that the stock price is going to fall and come closer to intrinsic value
1.2 Approaches To Fundamental Analysis
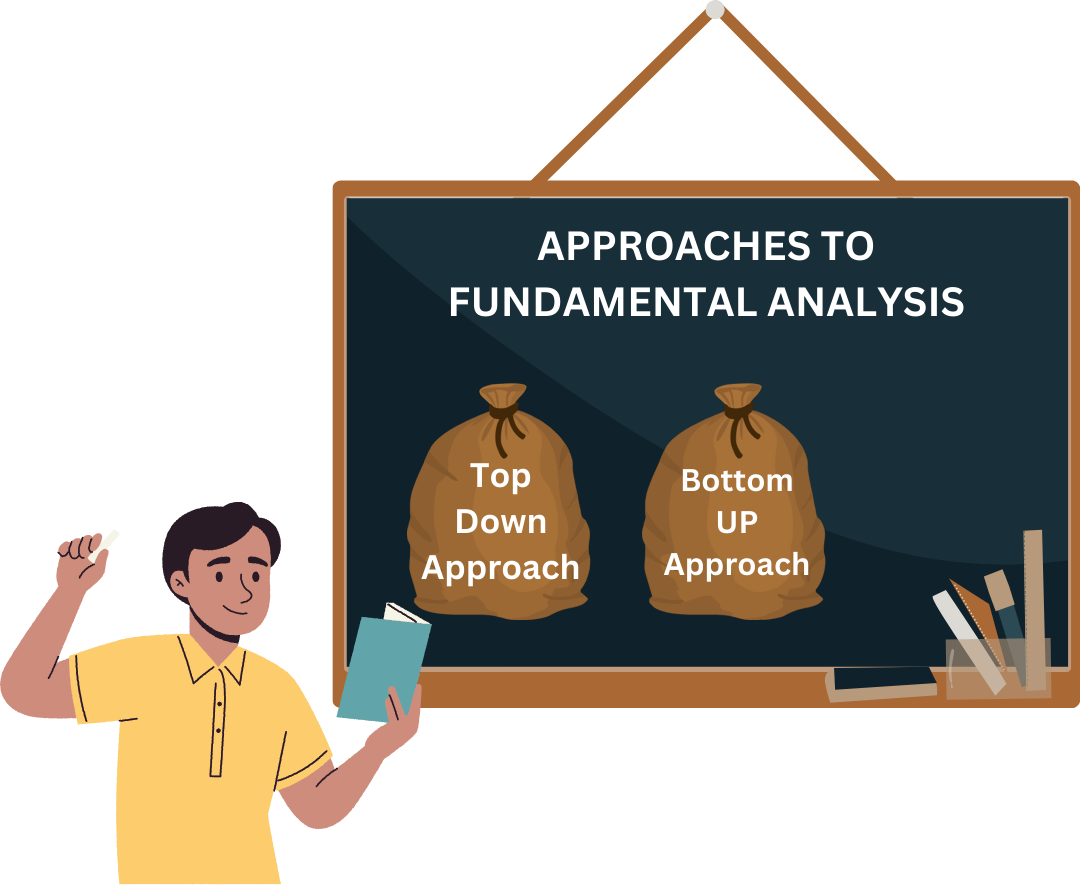
Top-Down Approach And Bottom-Up Approach.
Top down approach :
- With this approach the financial analysts are first involved in making forecasts for the economy, then for the industries and finally for the companies. The industry forecasts are based on the forecasts of the economy. Further a company's forecasts are based on the forecasts of the economy as well as the concerned industry.
- An investor who follows the top-down approach starts the analysis with the consideration of the health of the overall economy. By analyzing various macroeconomic factors such as interest rates, inflation, and GDP levels, an investor tries to determine the overall direction of the economy and identifies the industries and sectors of the economy offering the best investment opportunities.
- Afterward, the investor assesses specific prospects and potential opportunities within the identified industries and sectors. Finally, they analyze and select individual stocks within the most promising industries.
A person who considers using the top-down analysis approach is interested in taking a wider look at the international economy. Then, they determine and measure huge trends going on in the economies, and select the ones offering the most of the opportunities to grow. Industries falling in those macro trends are assessed, and ultimately, the selection of individual stocks lying in the feasible sectors or industries is made. Key points to remember:
Top-down analysis commences with the consideration of macro trends instead of stocks.
Top-down analysis is based on the analysis of global trends, sector analysis, and finally, stock analysis on an individual level.
Top-down analysis approach is considered in technical analysis for analyzing trends for larger time periods prior to restricting them with shorter time periods.
Bottom up approach:
- In case of bottom up approach, fundamental analysts forecast the prospects of the companies first, then for the industries and in the last forecast for the economy. Such bottom up forecasting may unknowingly involve inconsistent assumptions. Forecasts of the economy is of no use if it is done after company forecasts because ultimately it is the expected cash inflows from the company's share that will be used in finding out the intrinsic value of a share.
1.3 Who Uses Fundamental Analysis?
- Fundamental analysis is used largely by long-term or value investors to identify well-priced stocks and those with favorable prospects. Equity analysts will also use fundamental analysis to generate price targets and recommendations to clients (e.g., buy, hold, or sell). Warren Buffett, one of the world's most renowned value investors, is a promoter of fundamental analysis.
- Basically if you are an investor wanting to invest in a business for long term (3-5 years) fundamental analysis is for you. The thought process is over the long term, the stock prices of a fundamentally strong company tend to appreciate, thereby creating wealth for its investors.
- There are many such examples in the Indian market. To name a few, one can think of companies such as Infosys Limited, TCS Limited, Page Industries, Eicher Motors, Nestle India, TTK Prestige. Each of these companies have delivered on an average over 20% compounded annual growth return (CAGR) year on year for over 10 years. To give you a perspective, at a 20% CAGR the investor would double his money in roughly about 3.5 years. Higher the CAGR faster is the wealth creation process. Some companies such as Bosch India Limited have delivered close to 30% CAGR. Therefore, you can imagine the magnitude, and the speed at which wealth is created if one would invest in fundamentally strong companies.
1.4 Criticisms Of Fundamental Analysis

The biggest criticisms of fundamental analysis come primarily from two groups: proponents of technical analysis and believers of the efficient market hypothesis.
Technical Analyst
- Technical analysis is the other primary form of security analysis. Put simply, technical analysts base their investments (or, more precisely, their trades) solely on the price and volume movements of stocks. Using charts and other tools, they trade on momentum and ignore the fundamentals.
- One of the basic tenets of technical analysis is that the market discounts everything. All news about a company is already priced into the stock. Therefore, the stock's price movements give more insight than the underlying fundamentals of the business itself.
Efficient Market Hypothesis (EMH)
Followers of the efficient market hypothesis (EMH), however, are usually in disagreement with both fundamental and technical analysts. The efficient market hypothesis contends that it is essentially impossible to beat the market through either fundamental or technical analysis. Since the market efficiently prices all stocks on an ongoing basis, any opportunities for excess returns are almost immediately whittled away by the market's many participants, making it impossible for anyone to meaningfully outperform the market over the long term.
Weak form EMH
The weak form EMH stipulates that current asset prices reflect past price and volume information. The information contained in the past sequence of prices of a security is fully reflected in the current market price of that security. The weak form of the EMH implies that investors should not be able to outperform the market using something that "everybody else knows". Yet, many financial researchers study past stock price series and trading volume (using a technique called technical analysis) data in an attempt to generate profits.
Semi-strong form EMH
The semi-strong form of the EMH states that all publicly available information is similarly already incorporated into asset prices. In other words, all publicly available information is fully reflected in a security's current market price. Public information here includes not only past prices but also data reported in a company's financial statements, its announcements, economic factors and others. It also implies that no one should be able to outperform the market using something that "everybody else knows". The semi-strong form of the EMH thus indicates that a company's financial statements are of no help in forecasting future price movements and securing high investment returns in the long-term.
Strong form EMH
The strong form of the EMH stipulates that private information or insider information too is quickly incorporated in market prices and therefore cannot be used to reap abnormal trading profits. Thus, all information, whether public or private, is fully reflected in a security's current market price. This means no long-term gains are possible, even for the management of a company, with access to insider information. They are not able to take the advantage to profit from information such as a takeover decision which may have been made a few minutes ago. The rationale to support this is that the market anticipates in an unbiased manner, future developments and therefore information has been incorporated and evaluated into market price in a much more objective and informative way than company insiders can take advantage of.
Know Important Steps In Fundamental Analysis
2.1 Macro Economic Analysis

The level of economic activity has an impact on investment in many ways. If the economy grows rapidly, the industry can also be expected to show rapid growth and vice versa. When the level of economic activity is low, stock prices are low, and when the level of economic activity is high, stock prices are high reflecting the prosperous outlook for sales and profits of the firms. The analysis of macro economic environment is essential to understand the behaviour of the stock prices.
Macro Economics Factors
The commonly analysed macro economic factors are as follows.
Gross Domestic Product (GDP) - GDP indicates the rate of growth of the economy. GDP represents the aggregate value of the goods and services produced in the economy. GDP consists of personal consumption expenditure, gross private domestic investment and government expenditure on goods and services and net export of goods and services. The estimates of GDP are available on an annual basis. The rate of growth of GDP is around 6% in the nineties. The GDP growth in 1998-99 has accelerated to 5.8 percent compared to 5 per cent of the previous year. The growth rate of economy points out the prospects for the industrial sector and the return investors can expect from investment in shares. The higher growth rate is more favourable to the stock market.
Savings And Investment - It is obvious that growth requires investment which in turn requires substantial amount of domestic savings. Stock market is a channel through which the savings of the investors are made available to the corporate bodies. Savings are distributed over various assets like equity shares, deposits, mutual fund units, real estate and bullion. The saving and investment patterns of the public affect the stock to a great extent.
Inflation - Along with the growth of GDP, if the inflation rate also increases, then the real rate of growth would be very little. The demand in the consumer product industry is significantly affected. The industries which come under the government price control policy may lose the market, for example Sugar. The government control over this industry, affects the price of the sugar and thereby the profitability of the industry itself. If thee is a mild level of inflation, it is good to the stock market but high rate of inflation is harmful to the stock market.
Interest Rates - The interest rate affects the cost of financing to the firms. A decrease in interest rate implies lower cost of finance for firms and more profitability. More money is available at a lower interest rate for the brokers who are doing business with borrowed money.
Budget - The budget draft provides an elaborate account of the government revenues and expenditures. A deficit budget may lead to high rate of inflation and adversely affect the cost of production. Surplus budget may result in deflation. Hence, balanced budget is highly favourable to the stock market.
The Tax Structure - Every year in March, the business community eagerly awaits the Government's announcement regarding the tax policy. Concessions and incentives given to a certain industry encourages investment in that particular industry. Tax reliefs given to savings encourage savings. The minimum Alternative Tax (MAT) levied by the Finance Minister in 1996 adversely affected the stock market. Ten type of tax exemption has impact on the profitability of the industries.
The Balance Of Payment - The balance of payment is the record of a country's money receipts from and payments abroad. The difference bt6ween receipts and payments may be surplus or deficit. Balance of payment is a measure of the strength of rupee on external account. If the deficit increases, the rupee may depreciate against other currencies, thereby, affecting the cost of imports. The industries involved in the export and import are considerably affected by the changes in foreign exchange rate. The volatility of the foreign exchange rate affects the investment of the foreign institutional investors in the Indian stock market. A favourable balance of payment renders a positive effect on the stock market.
Monsoon And Agriculture - Agriculture is directly and indirectly linked with the industries. For example, Sugar, Cotton, Textile and Food processing industries depend upon agriculture for raw-material. Fertilizer and insecticide industries are supplying inputs to the agriculture. A good monsoon leads to higher demand for input and results in bumper crop. This would lead to buoyancy in the stock market. When the monsoon is bad, agricultural and hydel power production would suffer. They cast a shadow on the share market.
Infrastructure Facilities - Infrastructure facilities are essential for the growth of industrial and agricultural sector. A wide net work of communication system is a must for the growth of the economy. Regular supply of power without any power cut would boost the production. Banking and financial sectors also should be sound enough to provide adequate support to the industry and agriculture. Good infrastructure facilities affect the stock market favorably. In India even though infrastructure facilities have been developed, still they are not adequate. The government has liberalized its policy regarding the communication, transport and power sector. For example, power sector has been opened up to the foreign investors with assured rates of returns.
Demographic Factors - The demographic data provides details about the population by age, occupation, literacy and geographic location. This is needed to forecast the demand for the consumer goods. The population by age indicates the availability of able work force.
2.2 Economic Analysis

To estimate the stock price changes, an analyst has to analyse the macro economic environment and the factors peculiar to the industry he is concerned with. The economic activities affect the corporate profits, investors, attitude and the share prices. Fall in the GDP or a slackness inn the economic growth may lead to fall in corporate profit and consequently the security prices. For the purpose of economic analysis, an analyst should be familiar with the forecasting techniques. He should know the advantages and disadvantages of various techniques. The common techniques used are analysis of key economic indicators, diffusion index, surveys and econometric model building. These techniques help him to decide the right time to invest and the type of security he has to purchase i.e. stocks or bonds or some combination of stocks and bonds.
Key Economic Indicators
The economic indicators are factors that indicators are factors that i8ndicate the present status, progress or slow down of the economy. They are capital investment, business profits, money supply, GNP, interest rate, unemployment rate, etc. The economic indicators are grouped into leading, coincidental and lagging indicators. The indicators are selected on the following criteria.
Economic significance
Statistical adequacy
Timing
Conformity
Diffusion Index
Diffusion index is a composite or consensus index. The diffusion index consists of leading, coincidental and lagging indicators. This type of index has been constructed by the National Bureau of economic Research in USA. But the diffusion index is complex in nature to calculate and the irregular movements that occur in individual indicators cannot be completely eliminated.
Econometric Model Building
For model building several economic variables are taken into consideration. The assumptions underlying the analysis are specified. The relationship between the independent and dependent variables is given mathematically. While using the model, the analyst has to think clearly all the inter-relationships are specified, he can forecast not only the direction but also the magnitude. But his prediction depends on his understanding of economic theory and the assumption on which the model has been built. The models mostly use simultaneous equations.
2.3 Industry Analysis

An industry is a group of firms that have similar technological structure of production and produce similar products. For the convenience of the investors, the broad classification of the industry is given in financial dailies and magazines. Companies are distinctly classified to give a clear picture about their manufacturing process and products. The table below gives the industry wise classification given in Reserve Bank of INDIA Bulletin.
- Food products
- Beverages, Tobacco and Tobacco products
- Textiles
- Wood and wood products
- Leather and leather products
- Rubber and plastic products
- Chemical and chemical products
- Non-metallic mineral products
- Basic metals, Alloys and metal products
- Machinery and Machine tools
- Transport equipment and parts
- Other Miscellaneous manufacturing industries
Classification
These industries can be classified on the basis of the business cycle i.e. classified according to their reactions to the different phases of the business cycle. They are classified into growth, cyclical, defensive and cyclical growth industry.
Growth Industry - The growth industries have special features of high rate of earnings and growth in expansion, independent of the business cycle.
Cyclical Industry - The growth and the profitability of the industry move along with the business cycle. During the boom period they enjoy growth and during depression they suffer a set back. For example, the white goods like fridge, washing machine and kitchen range products command a good market in the boom period and the demand for them slackens during the recession.
Defensive Industry - Defensive industry defies the movement of the business cycle. Ford example, food and shelter are the basic requirements of humanity. The food industry withstands recession and depression.
Cyclical Growth Industry - This is a new type of industry that is cyclical and at the same time growing. For example, the automobile industry experiences periods of stagnation, decline but they grow tremendously. The changes in technology and introduction of new models help the automobile industry to resume their growth path.
Life Cycle
In each of these industry- it is also important to understand what is the industry life cycle. The industry life cycle theory is generally attributed to Julius Grodensky. The life cycle of the industry is separated into four well defined stages such as
Pioneering stage - The prospective demand for the product is promising in this stage and the technology of the product is low. The demand for the product attracts many producers to produce the particular product.
Rapid growth stage - This stage starts with the appearance of surviving firms from the pioneering stage. The companies that have withstood the competition grow strongly in market share and financial performance.
Maturity and stabilization stage - In the stabilization stage, the growth rate tends to moderate and the rate of growth would be more or less equal to the industrial growth rate or the gross domestic product growth rate.
Declining stage - In this stage, demand for the particular product and the earnings of the companies in the industry decline. Now-a-days very few consumers demand black and white T.V. Innovation of new products and changes in consumer preferences lead to this stage. The specific feature of the declining stage is that even in the boom period, the growth of the industry would even in the boom period. Investment in the shares of these types of companies leads to erosion of capital.
Factors To Be Considered
Apart from industry life cycle analysis, the investor has to analyse some other factors too. They are as listed below
Growth of the industry - The historical performance of the industry in terms of growth and profitability should be analysed. Industry wise growth is published periodically by the Centre for Monitoring Indian Economy.
Cost structure and profitability - The cost structure, that is the fixed and variable cost, affects the cost of production and profitability of the firm.
Nature of the product - The products produced by the industries are demanded by the consumers and other industries.
Nature of the competition - Nature of competition is an essential factor that determines the demand for the particular product, its profitability and the price of the concerned company scrips.
Government policy - The government policies affect the very nerve of the industry and the effects differ from industry to industry. Tax subsidies and tax holidays are provided for export oriented products. Government regulates the size of the production and the pricing of certain products. The sugar, fertilizer and pharmaceutical industry are often affected by the inconsistent government policies. Control and decontrol of sugar price affect the profitability of the sugar industry. In some cases entry barriers are placed by the government. In the airways, private corporates are permitted to operate the domestic flights only. When selecting an industry, the government policy regarding the particular industry should be carefully evaluated. Liberalisation and delicensing have brought immense threat to the existing domestic industries in several sectors.
Labour - The analysis of labour scenario in a particular industry is of great importance. The number of trade unions and their operating mode have impact on the labour productivity and modernization of the industry. Textile industry is known for its militant trade unions. If the trade unions are strong and strikes occur frequently, it would lead to fall in the production.
Research and Development - For any industry to survive the competition in the national and international markets, product and production process have to be technically competitive. This depends on the R$D in the particular company or industry.
Pollution Standards - Pollution standards are very high and strict in the industrial sector. For some industries it may be heavier than others; for example, in leather, chemical and pharmaceutical industries the industrial effluents are more.
SWOT Analysis
The above mentioned factors themselves would become strength, weakness, opportunity and threat (SWOT) for the industry. Hence, the investor should carry out a SWOT analysis for the chosen industry. Take for instance, increase in demand for the industry's product becomes its strength, presence of numerous players in the market, i.e. competition becomes the threat to a particular company in the respective industry. The progress in the research and development in that particular industry is an opportunity and entry of multinationals in the industry and cheap imports of the particular products are threat to that industry. In this way the factors have to be arranged and analysed. To make the industry analysis more explanatory it has been carried out on the pharmaceutical industry and SWOT analysis results are also given.
2.4 Company Analysis

In the company analysis the investor assimilates the several bits of information related to the company and evaluates the present and future values of the stock. The risk and return associated with the purchase of the stock is analysed to take better investment decisions. The valuation process depends upon the investors ability to elicit information from the relationship and inter-relationship among the company related variables.
Points to Analyze in a Company
The Competitive Edge Of The Company - Major industries in India are composed of hundreds of individual companies. In the information technology industry even though the number of companies is large, few companies like Tata Infotech, Satyam computers, Infosys, NIIT etc. , control the major market share. The competitiveness of the company can be studied with the help of:
The market share - The market share of the annual sale helps to determine a company's relative competitive position within the industry. If the market share is high, the company would be able to meet the competition successfully.
Growth Of Sales - The Company may be a leading company, but if the growth in sales is comparatively lower than another company, it indicates the possibility of the company losing the leadership. The rapid growth in sales would keep the shareholder in a better position than one with the stagnant growth rate.
Stability Of Sales - If a firm has stable sales revenue, other things being remaining constant, will have more stable earnings. Wide variation in sales leads to variations in capacity utilization, financial planning and dividend.
Earnings Of The Company - Sales alone do not increase the earnings but the costs and expenses of the company also influence the earnings of the company. Further, earnings do not always increase with the increase in sales. The company's sales might have increased buy its earnings per share may decline due to the rise in costs. The rate of change in earnings differs from the rate of change of sales. Sales may increase by 10% in a company but earnings per share may increase only by 5%. Even though there is a relationship between sales and earnings, it is not a perfect one. Sometimes, the volume of sales may decline but the earnings may improve due to the rise in the unit price of the article. Hence, the investor should not depend only on he sales, but should analyse the earnings of the company.
Management - Good and capable management generates profit to the investors. The management of the firm should efficiently plan, organize, actuate and control the activities of the company. The basic objective of management is to attain the stated objectives of company for the good of the equity holders, the public and the employees. If the objectives of the company are achieved, investors will have a profit. A management that ignores profit does more harm to the investors than one that over emphasises it.
2.5 Financial Analysis
The best source of financial information about a company is its own financial statements. This is primary source of information for e valuating the investment prospects in the particular company's stock. Financial statement analysis is the study of a company's financial statement from various viewpoints. The statement gives the historical and current information about the company's operations. Historical financial statement helps to predict the future. The two main statements used in the analysis are:
The Balance Sheet
The balance sheet shows all the company's sources of fund (liabilities and stockholder's equity) and uses of funds at a given point of time. The balance sheet can either be in the horizontal form or vertical form.
The Profit And Loss Account
Analysis of the financial condition of the company requires a report on the flow of funds too. The income statement reports the flow of funds from business operations that take place in between two points of time. It lists down the items of income and expenditure. The difference between the income and expenditure represents profit or loss for the period. It is also called income and expenditure statement.
Analysis Of Financial Statements
The analysis of financial statements reveals the nature of relationship between income and expenditure, and the sources and application of funds. The investor determines the financial position and the progress of the company through analysis. The investor is interested in the yield and safety of his capital. He cares much about the profitability and the management's policy regarding the dividend. Towards this end, he can use the following simple analysis:
Comparative Financial Statement - In the comparative statement balance sheet figures are provided for ore than one year. The comparative financial statement provides time perspective to the balance sheet figures. The annual date are compared with similar data of previous years, either in absolute terms or in percentages.
Trend Analysis - Here percentages are calculated with a base year. This would provide insight into the growth or decline of the sale or profit over the years. Sometimes sales may be increasing continuously, and the inventories may also be rising. This would indicate the loss of market share of the particular company's product. Likewise sales may have an increasing trend but profits may remain the same. Here the investor has to look in the cost and management efficiency of the company.
Comon Size Statement - Common size balance sheet shows the percentage of each asset item to the total assets and each liability item to the total liabilities. Similarly, a common size income statement shows each item of expense as a percentage of net sales. With common size statement comparison can be made between two different size firms belonging to the same industry. For a same company over the years common size statement can be prepared.
Fund Flow Analysis - The balance sheet gives a static picture of the company's position on a particular date. It does not reveal the changes that have occurred in the financial position of the unit over a period of time. The investor should know,
How are the profits utilized?
Financial source of dividend
Source of finance for capital expenditures
Source of finance for repayment of debt
The destiny of the sale proceeds of the fixed assets and
Use of the proceeds of the proceeds of the share or debenture issue or fixed deposits raised from public.
These items of information are provided in the funds flow statement. It is a statement of the sources and applications of funds. It highlights the changes in the financial condition of a business enterprise between two balance sheet dates. The investor could see clearly the amount of funds generated or lost in operations. He could see how these funds have been divided into three significant uses like taxes, dividends and reserves. Moreover, the application of long the funds towards the acquisition of current assets can be found out. This would reveal the real picture of the financial position of the company.
Cash Flow Statement - The investor is interested in knowing the cash inflow and outflow of the enterprise. The cash flow statement is prepared with the help of balance sheet, income statement and some additional information. It can be either prepared in the vertical form or in the horizontal form. Cash flows related to operations and other transactions are calculated. The statement shows the causes of changes in cash balance between two balance sheet dates. With the help of this statement the investor can review the cash movements over an operating cycle. The factors responsible for the reduction of cash balance in spite of increase in profits or vice versa can be found out
Ratio Analysis - Ratio is a relationship between two figures expressed mathematically. Financial ratio provides numerical relationship between two relevant financial data. Financial ratios are calculated from the balance sheet and profit and loss account. The relationship can be either expressed as a percent pr as a quotient. Ratios summaries the data for easy understanding, comparison and interpretation.
2.6 Valuation

- Valuation analysis is conducted to decide whether the stock of a company is currently selling at attractive (cheap/undervalued), fair (rightly priced) or expensive (overvalued) valuations. It is done post-financial analysis, to select stocks for further analysis.
- Once an investor has found a financially strong company by using the parameters highlighted in the financial analysis guide, she should do the valuation analysis to check whether the stock of the company is priced right.
- If the shares of a company are overvalued then the investor should avoid investing in it, however good the company's financial position may be. Investing hard-earned money in overvalued stocks exposes the investor to higher levels of risk where the potential of future appreciation is limited but the risk of loss of money is high. Therefore, valuation analysis becomes paramount before taking a decision to buy any stock.
- Valuation analysis compares the stock market values of the stock of a company with its financial parameters. Stock market values consist of the current market price (CMP), market capitalization (MCap) etc. Various financial parameters, which are used in valuation analysis, are earning per share (EPS), sales, sales growth rate, earnings (EPS) growth rate, book value, shareholder's equity, dividend payout etc
Understanding Basic Terms In Fundamental Analysis
3.1 Time Value Of Money

If we have to evaluate, what would be the value of money that we have today sometime in the future, then we need to move the 'money today' through the future. This is called the "Future Value (FV)" of the money. Likewise, if we have to evaluate the value of money that we are expected to receive in the future in today's terms, then we have to move the future money back to today's terms. This is called the "Present Value (PV)" of money. In both the cases, as there is a passage of time, the money has to be adjusted for the opportunity cost. This adjustment is called "Compounding" when we have to calculate the future value of money. It is called "Discounting" when we have to calculate the present value of money.
The present value of an asset could be shown to be:
PV= FV/(1+r)^t
The Future Value of an asset is calculated as:
FV= PV*(1=r)^t
Where,
PV = Present Value
FV = Future Value
r = Discount Rate
t = Time
Example 1: How much is Rs.10000/- in today's terms worth five years later assuming an opportunity cost of 10%?
This is a case of Future Value (FV) computation, as we are trying to evaluate the future value of the money that we have today -
Future Value = Present Value * (1+ opportunity cost rate) ^ Number of years.
= 10000 *(1 + 1.10%) ^ 5 = 16105.
This means Rs.10000 today is comparable with Rs.16105 after 5 years, assuming an opportunity cost of 10%
Example 2: How much is Rs.10,000/- receivable after 6 years, worth in today's terms assuming an opportunity cost of 10%?
This is clearly the case of Present Value (PV) computation as we are trying to evaluate the present value of cash receivable in future in terms of today's value.
Present Value = Amount / (1+Discount Rate) ^ Number of years
= 10,000 / (1+ 10% ) ^ 6 = 5644
This means Rs.10,000/- receivable after 6 years in future is comparable to Rs.5644 in today's terms assuming a discount rate of 10%
Thus, the time value of money is like your money getting older. There are things you can do in your 20s that hurt when you are in your 40s. Just try hiking that mountain. Even though the mountain hasn't changed, it requires a different amount of effort, pain, and dedication to get to the top. The same hundred-rupee note in 20 years from now is a lot weaker than that hundred-rupee note in your pocket today - due both to inflation and the interest you could earn on it in the meantime.
3.2 Net Present Value Of The Asset

Net Present Value (NPV) is the value of all future cash flows (positive and negative) over the entire life of an investment discounted to the present.
Basically it refers to the rupee value derived by deducting the present value of all the cash outflows of the company from the present value of the total cash inflows. It is widely used in finance and to know the profitability of the project.
- If the Net present value is positive, then the project should be accepted. It indicates that earning from the project is more than the amount invested in the project, so the project should be accepted.
- If the Net present value is negative, then it indicates that the project in which we invested the money does not provide a positive return, so the project should be rejected.
Mathematically, NPV Formula is represented as,
NPV = Cash Flows /(1- i)t - Initial Investment
Where,
- i stands for the Required Rate of Return or Discount Rate
- t stands for Time or Number of Period
Example-
Lets say a friend of your needs Rs.500 now, and will pay you back Rs.570 in a year. Is that a good investment when you can get 10% elsewhere?
Money Out: Rs.500 now
You invested Rs.500 now, so PV = -500.00
Money In: Rs.570 next year
PV = 570 / (1+0.10)1= 570 / 1.10 = Rs.518.18
The Net Amount is:
Net Present Value = 518.18 - 500.00 = 18.18
So, at 10% interest, that investment is worth 18.18
A Net Present Value (NPV) that is positive is good (and negative is bad).
But your choice of interest rate can change things!
Example: Same investment, but try it at 15%
Money Out: 500
You invested 500 now, so PV = -500.00
Money In: 570 next year:
PV = 570 / (1+0.15)1 = 570 / 1.15 = 495.65
Work out the Net Amount:
Net Present Value = 495.65 - 500.00 = -4.35
So, at 15% interest, that investment is worth - Rs.4.35
It is a bad investment. But only because you are demanding it earn 15% (maybe you can get 15% somewhere else at similar risk).
Let us try a bigger example.
Example: Invest Rs.2,000 now, receive 3 yearly payments of Rs.100 each, plus Rs.2,500 in the 3rd year. Use 10% Interest Rate.
Let us work year by year (remembering to subtract what you pay out):
- Now: PV = -2,000
- Year 1: PV = 100 / 1.10 = 90.91
- Year 2: PV = 100 / 1.102= 82.64
- Year 3: PV = 100 / 1.103= 75.13
- Year 3 (final payment): PV = 2,500 / 1.103= 1,878.29
Adding those up gets: NPV = -2,000 + 90.91 + 82.64 + 75.13 + 1,878.29 = 126.97
Looks like a good investment.
Why is the NPV higher when the interest rate is lower?
- Because the interest rate is like the team you are playing against, play an easy team (like a 6% interest rate) and you look good, a tougher team (like a 10% interest) and you don't look so good!
- You can actually use the interest rate as a "test" or "hurdle" for your investments: demand that an investment have a positive NPV with, say, 6% interest.
3.3 Opportunity And Discount Factors

Opportunity Cost
Opportunity cost is the cost of any activity measured in terms of the value of the other alternative that is not chosen (that is foregone). Put another way, it is the benefit you could have received by taking an alternative action; the difference in return between a chosen investment and one that is not taken. Say you invest in a stock and it returns 10% over a year. In placing your money in the stock, you gave up the opportunity of another investment - say, a fixed deposit yielding 8%. In this situation, your opportunity costs are 2% (10% - 8%). But do you expect only fixed deposit returns from stocks? Certainly not. You expect to earn more than the return from fixed deposit when you invest in stocks. Otherwise you are better off with fixed deposits. The reason you expect higher returns from stocks is because the stocks are much riskier as compared to fixed deposits. This extra risk that you assume when you invest in stocks calls for additional return that you assume over other risk-free (or near risk-free) return.
The discount rate of cost of capital to be used in case of discounting future cash flows to come up with their present value is termed as Weighted Average Cost of Capital (WACC).
Where
D = Debt portion of the Total Capital Employed by the firm
TC = Total Capital Employed by the frim (D+E+P)
Kd = Cost of Debt of the Company.
t = Effective tax rate of the firm
E = Equity portion of the Total Capital employed by the firm
P = Preferred Equity portion of the Total Capital employed by the firm
Kp = Cost of Preferred Equity of the firm
The Cost of equity of the firm, Ke (or any other risky asset) is given by the Capital Asset
Pricing Model (CAPM)

or,
![]()
Where
Rf = Risk-free rate
β = Beta, the factor signifying risk of the firm
Rm = Implied required rate of return for the market
Risk-Free Rate
The risk-free interest rate is the theoretical rate of return of an investment with zero risk, including default risk. Default risk is the risk that an individual or company would be unable to pay its debt obligations. The risk-free rate represents the interest an investor would expect from an absolutely risk-free investment over a given period of time.
Though a truly risk-free asset exists only in theory, in practice most professionals and academics use short-dated government bonds of the currency in question. The risk-free interest rate for the Indian Rupee for Indian investors would be the yield on Indian government bonds denominated in Indian Rupee of appropriate maturity.
These securities are considered to be risk-free because the likelihood of governments defaulting is extremely low and because the short maturity of the bills protect investors from interest-rate risk that is present in all fixed rate bonds .
Though Indian government bond is a risk less security per se, a foreign investor may look at the India's sovereign risk which would represent some risk. As India's sovereign rating is not the highest a foreign investor may consider investing in Indian government bonds as not a risk free investment.
Equity Risk Premium
The notion that risk matters and that riskier investments should have higher expected returns than safer investments, to be considered good investments, is both central to modern finance.
Thus, the expected return on any investment can be written as the sum of the risk-free rate and a risk premium to compensate for the risk. The equity risk premium reflects fundamental judgments we make about how much risk we see in an economy/market and what price we attach to that risk.
In effect, the equity risk premium is the premium that investors demand for the average risk investment and by extension, the discount that they apply to expected cash flows with average risk.
When equity risk premia rises, investors are charging a higher price for risk and will therefore pay lower prices for the same set of risky expected cash flows. Equity risk premia are a central component of every risk and return model in finance and is a key input into estimating costs of equity and capital in both corporate finance and valuation.
The Beta
The Beta is a measure of the systematic risk of a security that cannot be avoided through diversification. Therefore, Beta measures non-diversifiable risk. It is a relative measure of risk: the risk of an individual stock relative to the market portfolio of all stocks. Beta is a statistical measurement indicating the volatility of a stock’s price relative to the price movement of the overall market. Higher-beta stocks mean greater volatility and are therefore considered to be riskier but are in turn supposed to provide a potential for higher returns; low-beta stocks pose less risk but also lower returns
Thus, it is a measure of the volatility-or systematic risk-of a security or portfolio compared to the market as a whole. Beta data about an individual stock can only provide an investor with an approximation of how much risk the stock will add to a (presumably) diversified portfolio. For beta to be meaningful, the stock should be related to the benchmark that is used in the calculation.
Formula
Where,
![]() = Beta of security with market
= Beta of security with market
![]() = Covariance between security and market
= Covariance between security and market
![]() = Variance of market returns
= Variance of market returns
OR
Where
![]() = Coefficient of Correlation between security and market returns
= Coefficient of Correlation between security and market returns
How Beta Works ?
A beta coefficient can measure the volatility of an individual stock compared to the systematic risk of the entire market. In statistical terms, beta represents the slope of the line through a regression of data points. In finance, each of these data points represents an individual stock's returns against those of the market as a whole. Beta effectively describes the activity of a security's returns as it responds to swings in the market. A security's beta is calculated by dividing the product of the covariance of the security's returns and the market's returns by the variance of the market's returns over a specified period.
Types Of Beta Values
- Beta Value Equal To 1.0
- If a stock has a beta of 1.0, it indicates that its price activity is strongly correlated with the market. A stock with a beta of 1.0 has systematic risk. However, the beta calculation can't detect any unsystematic risk. Adding a stock to a portfolio with a beta of 1.0 doesn't add any risk to the portfolio, but it also doesn't increase the likelihood that the portfolio will provide an excess return.
- Beta Value Less Than One
- A beta value that is less than 1.0 means that the security is theoretically less volatile than the market. Including this stock in a portfolio makes it less risky than the same portfolio without the stock. For example, utility stocks often have low betas because they tend to move more slowly than market averages.
- Beta Value Greater Than One
- A beta that is greater than 1.0 indicates that the security's price is theoretically more volatile than the market. For example, if a stock's beta is 1.2, it is assumed to be 20% more volatile than the market. Technology stocks and small cap stocks tend to have higher betas than the market benchmark. This indicates that adding the stock to a portfolio will increase the portfolio's risk, but may also increase its expected return.
- Negative Beta Value
- Some stocks have negative betas. A beta of -1.0 means that the stock is inversely correlated to the market benchmark. This stock could be thought of as an opposite, mirror image of the benchmark's trends. Put options and inverse ETFs are designed to have negative betas. There are also a few industry groups, like gold miners, where a negative beta is also common.
Problems With Beta
- The Beta is just a tool and as is the case with any tool, is not infallible. While it may seem to be a good measure of risk, there are some problems with relying on beta scores alone for determining the risk of an investment. Beta is not a sure thing. For example, the view that a stock with a beta of less than 1 will do better than the market during down periods may not always be true in reality. Beta scores merely suggest how a stock, based on its historical price movements will behave relative to the market.
- Beta looks backward and history is not always an accurate predictor of the future. Beta also doesn't account for changes that are in the works, such as new lines of business or industry shifts. Indeed, a stock's beta may change over time though usually this happens gradually.
Understanding Financial Statements In Stock Market
4.1 What Is An Annual Report?

- An annual report is a financial summary of a company's activities during the year along with management's analysis of the company's current financial position and future plans. Annual reports are prepared at the end of the fiscal year for external users to gain financial information about the inner workings of the company and what management plans to do in the future.
- Potential investors and the present shareholders are the primary audience for the annual report. Annual reports ideally provide the most pertinent information to an investor and is also used to communicate the company's primary message. For an investor, the annual report must be the default option to seek information about a company. Of course there are many media websites claiming to give the financial information about the company; however the investors should avoid seeking information from such sources. Remember the information is more reliable if we get it get it directly from the annual report.
4.2 How Can An Annual Report Be Used?
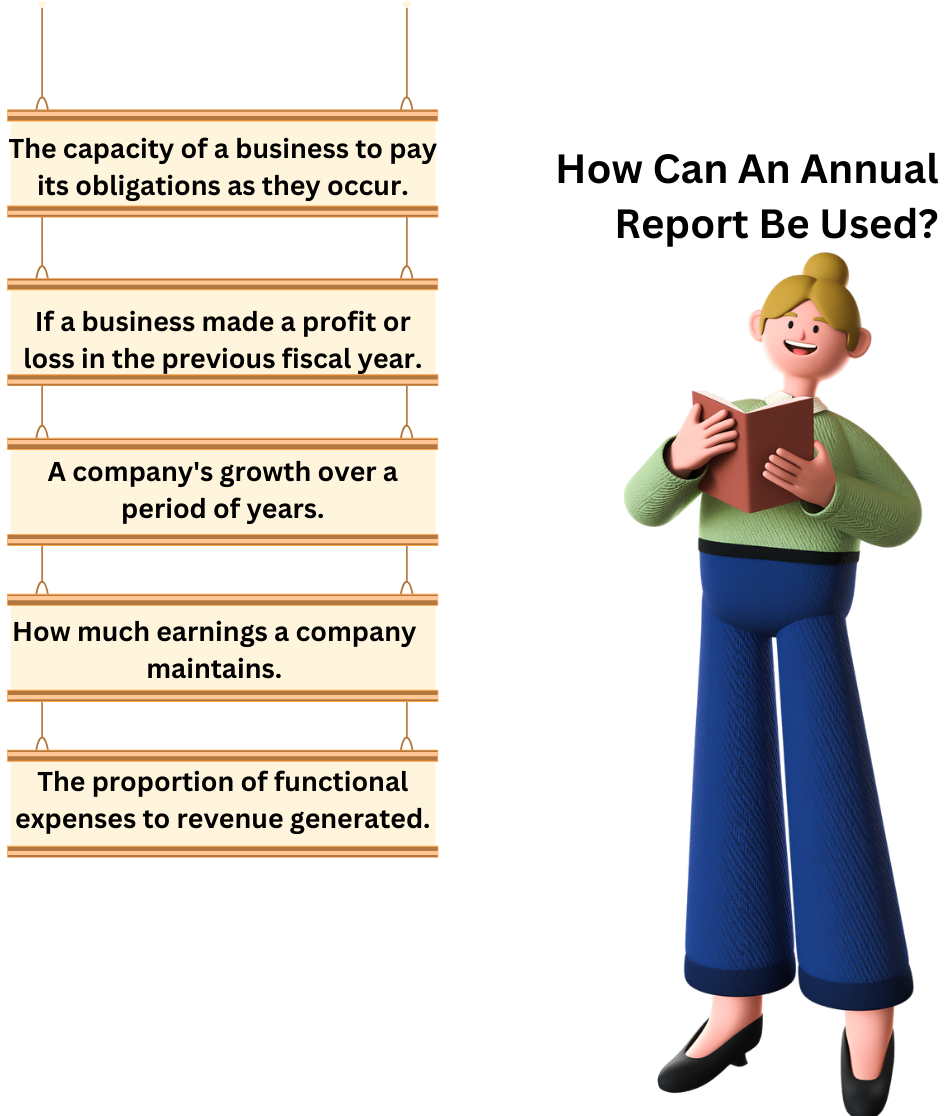
The annual report provides details on the financial condition of a company which can be used to measure:
The capacity of a business to pay its obligations as they occur.
If a business made a profit or loss in the previous fiscal year.
A company's growth over a period of years.
How much earnings a company maintains to increase its profits.
The proportion of functional expenses to revenue generated.
4.3 Key Components Of The Annual Report
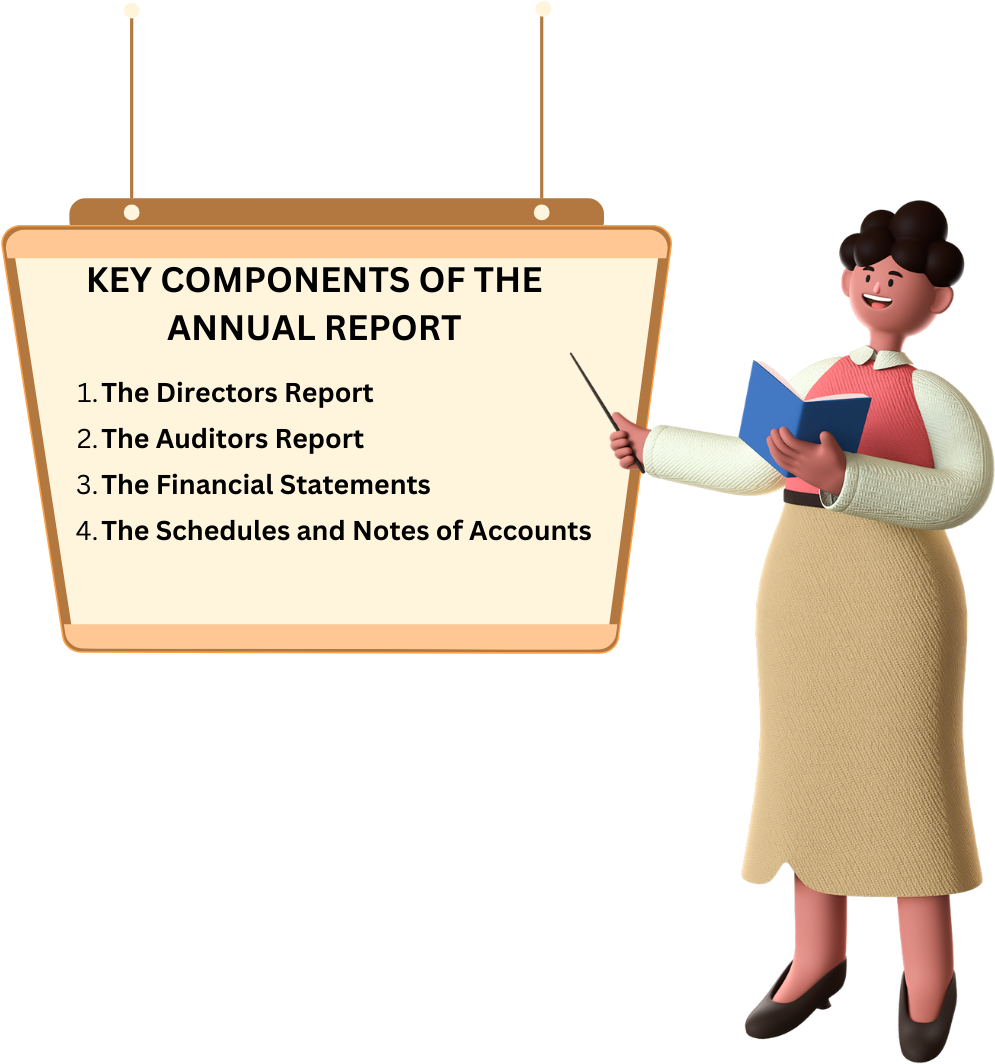
The Annual Report is usually broken down into the following specific parts:
- The Directors Report
- The Auditors Report
- The Financial Statements
- The Schedules and Notes of Accounts
4.4 Directors Report

The Director's Report
- Director's report is a financial disclosure made by director to the shareholders of the company. It is envisaged to disclose financial status of the company by disclosing company's affairs and scope of work along with its subsidiaries. It is basically financial summary of the company for the whole financial year and future vision too.
The Objective Of Directors Report
A director of the company needs to prepare and submit a said report to shareholders of the company at every annual general meeting every year in order to maintain transparency in the company. It helps stakeholders of the company understand the current financial status of the company and future scope and understand:
The current financial health of the company
Company's capability to diversify and grow
Company's status and position in the current market and future scope and growth
Whether company is following current regulations, standards, and social responsibility as required by various regulators like ROC, RBI, SEBI, etc.
It enunciates the opinion of the directors on the state of the economy and the political situation vis-A-vis the company.
Explains the performance and the financial results of the company in the period under review. This is an extremely important part. The results and operations of the various separate divisions are usually detailed and investors can determine the reasons for their good or bad performance.
The Director's Report details the company's plans for modernization, expansion and Without these, a company will remain static and eventually decline.
Discusses the profits earned in the period under review and the dividend recommended by the directors. This paragraph should normally be read with sane scepticism as the directors will always argue that the performance was satisfactory.
If profits have improved the reasons stated would invariably be superior technology adopted, intense marketing and hard work in the face of severe competition etc. If profits are low, adverse economic conditions are usually blamed for the same.
Elaborates on the directors views of the company's prospects for the future.
Discusses plans for new acquisitions and investments.
An investor must intelligently evaluate the issues raised in a Director's Report. If the report talks about diversification, one must the question that though diversification is a good strategy, does it make sense for the company? Industry conditions, the management's knowledge of the new business must be considered. Although companies must diversify in order to spread the risks of economic slumps, every diversification may not suit a company.
Similarly, all other issues raised in the Director's Report should be analysed.
Did the company perform as well as others in the same industry?
Is the finance being raised the most logical and beneficial to the company?
It is imperative that the investor read between the lines of the Director's Report and find the answers to these and many other questions. In short, a Director's Report is valuable and if read intelligently can give the investor a good grasp of the workings of a company, the problems it faces, the direction it intends taking and its future prospects.
What Does Directors Report Covers?
Company's description and details of current shareholders and other key managerial personnel's
Directors description submitting director's report
Description of companies trading activity
Future vision and prospectus of the company
Submission and description of financial records and statement of the company before members
Current Balance sheet, profit and loss, and cash flow description along with auditor's report
Dividend recommendation for current financial year
Any financial incidence that may affect company's financial position in the future
Is It Mandatory To Submit Director's Report?
- A director of the company is liable to submit director report every financial year before shareholders of the company. Companies act, 2013 has made it mandatory to file this report as per many sections embedded in the act whereas, in the erstwhile act, only section 217 talked about director's report.
4.5 Auditors Report
The Auditor's Report
An auditor's report is a written letter from the auditor containing their opinion on whether a company's financial statements comply with generally accepted accounting principles (GAAP) and are free from material misstatement. The independent and external audit report is typically published with the company's annual report. The auditor's report is important because banks and creditors require an audit of a company's financial statements before lending to them.
Key Points:
The auditor's report is a document containing the auditor's opinion on whether a company's financial statements comply with GAAP and are free from material misstatement.
The audit report is important because banks, creditors, and regulators require an audit of a company's financial statements.
A clean audit report means a company followed accounting standards while an unqualified report means there might be errors.
An adverse report means that the financial statements might have had discrepancies, misrepresentations, and didn't adhere to GAAP.
How An Auditor's Report Works
An auditor's report is a written letter attached to a company's financial statements that expresses its opinion on a company's compliance with standard accounting practices. The auditor's report is required to be filed with a public company's financial statements when reporting earnings to the Stock exchange
However, an auditor's report is not an evaluation of whether a company is a good investment. Also, the audit report is not an analysis of the company's earnings performance for the period. Instead, the report is merely a measure of the reliability of the financial statements.
The Components Of An Auditor's Report
Auditor report usually consists of three paragraphs.
The first paragraph states the responsibilities of the auditor and directors.
The second paragraph contains the scope, stating that a set of standard accounting practices was the guide.
The third paragraph contains the auditor's opinion.
An additional paragraph may inform the investor of the results of a separate audit on another function of the entity. The investor will key in on the third paragraph, where the opinion is stated.
The type of report issued will be dependent on the findings by the auditor. Below are the most common types of reports issued for companies.
Clean Or Unqualified Report
A clean report means that the company's financial records are free from material misstatement and conform to the guidelines set by GAAP. A majority of audits end in unqualified, or clean, opinions.
Qualified Opinion
A qualified opinion may be issued in one of two situations: first, if the financial statements contain material misstatements that are not pervasive; or second, if the auditor is unable to obtain sufficient appropriate audit evidence on which to base an opinion, but the possible effects of any material misstatements are not pervasive. For example, a mistake might have been made in calculating operating expenses or profit. Auditors typically state the specific reasons and areas where the issues are present so that the company can fix them.
Adverse Opinion
An adverse opinion means that the auditor has obtained sufficient audit evidence and concludes that misstatements in the financial statements are both material and pervasive. An adverse opinion is the worst possible outcome for a company and can have a lasting impact and legal ramifications if not corrected. Regulators and investors will reject a company's financial statements following an adverse opinion from an auditor. Also, if illegal activity exists, corporate officers might face criminal charges.
Disclaimer Of Opinion
A disclaimer of opinion means that, for some reason, the auditor is unable to obtain sufficient audit evidence on which to base the opinion, and the possible effects on the financial statements of undetected misstatements, if any, could be both material and pervasive. Examples can include when an auditor can't be impartial or wasn't allowed access to certain financial information.
The Idea Of Materiality In Audit Reports
Materiality is the idea that certain changes are significant enough to potentially change the investment decisions of investors and potential investors. it means that issues that only deal with a small portion, i.e., 1% of net income, are not material. Auditors are primarily concerned with material misstatements, which include omissions or other errors that individually or in the aggregate would reasonably be expected to influence the economic decisions of users. Materiality is pivotal in the course of an audit and affects what type of report the auditor will issue.
4.6 Financial Statements

Financial Statements
For a potential investor to make an informed decision as to whether to purchase shares of a company, he or she needs some information about its internal operation and financial status. What does the company own? What does it owe to others? How much money is it making? How is it using that money? The published financial statements in an Annual report provides the investor with this information. To ensure that this report is accurate and understandable to investors and can be compared with the equivalent disclosures by other firms, there is a set of generally accepted accounting principles (GAAP) that specify the definitions and conventions that must be adhered to in presenting the information.
There are three statements that provide the majority of the information in the annual report, which are:
Balance sheet: Summarizes the assets (things owned) and liabilities (things owed) of the company and how they are financed through a mixture of debt (borrowed money) and equity (funds contributed by the shareholder owners).
Income statement: Summarizes the revenue, expenses, and resulting income in the period.
Statement of cash flows: Summarizes the sources and uses of cash
We will understand each of these statements in detail over the next few chapters. However at this stage it is important to understand that the financial statements come in two forms.
Standalone financial statement or simply standalone numbers and
Consolidated financial statement or simply consolidated numbers
To understand the difference between standalone and consolidated numbers, we need to understand the structure of a company. Typically, a well established company has many subsidiaries. These companies also act as a holding company for several other well established companies.
Standalone Financial statements represent the standalone numbers/ financials of the company itself and do not include the financials of its subsidiaries. However the consolidated numbers includes the companies (i.e. standalone financials) and its subsidiaries financial statements.
4.7 Schedule And Notes Of Accounts

Schedules And Notes To The Accounts
The schedules and notes to the accounts are an integral part of the financial statements of a company and it is important that they be read along with the financial statements.
Schedules - The schedules detail pertinent information about the items of Balance Sheet and Profit & Loss Account. It also details information about sales, manufacturing costs, administration costs, interest, and other income and expenses. This information is vital for the analysis of financial statements. The schedules enable an investor to determine which expenses increased and seek the reasons for this. Similarly, investors would be able to find out the reasons for the increase or decrease in sales and the products that are sales leaders. The schedules even give details of stocks and sales, particulars of capacity and productions, and much other useful information.
Notes - The notes to the accounts are even more important than the schedules because it is here that very important information relating to the company is stated. Notes can effectively be divided into:
Accounting Policies - All companies follow certain accounting principles and these may differ from those of other entities. As a consequence, the profit earned might differ. Companies have also been known to change (normally increase) their profit by changing the accounting policies. The accounting policies normally detailed in the notes relate to:
How sales are accounted for?
What the research and development costs are?
How the gratuity liability is expensed?
How fixed assets are valued?
How depreciation is calculated?
How stock, including finished goods, work in progress, raw materials and consumable goods are valued?
How investments are stated in the balance sheet?
How has the foreign exchange translated?
Contingent Liabilities - Contingent liabilities are liabilities that may arise up on the happening of an event. It is uncertain however whether the event itself may happen. This is why these are not provided for and shown as an actual liability in the balance sheet. Contingent liabilities are detailed in the Financial Statements as a note to inform the readers of possible future liabilities while arriving at an opinion about the company. The contingent liabilities one normally encounters are:
Bills discounted with banks - These may crystallize into active liabilities if the bills are dishonoured.
Gratuity to employees not provided for
Claims against a company not acknowledged or accepted
Excise claims against the company etc.
Others - It must be appreciated that the purpose of notes to the accounts is to inform the reader more fully. Consequently, they detail all pertinent factors which affect, or will affect, the company and its results. Often as a consequence, adjustments may need to be made to the accounts to unearth the true results. The more common notes one comes across are:
Whether provisions for known or likely losses have been made.
Estimated value of contracts outstanding.
Interest not provided for.
Arrangements agreed by the company with third parties.
Agreement with labour.
The importance of these notes cannot be overstressed. It is imperative that investors read these carefully.