Iron - Iron carbide equilibrium diagram is very much useful in understanding the microstructures and properties of cast irons and carbon steels.
IRON-IRON CARBIDE EQUILIBRIUM DIAGRAM
✓ Iron - Iron carbide equilibrium diagram is very much useful in understanding the microstructures and properties of cast irons and carbon steels.
✓ It is also used to understand the basic differences among iron vinom alloys and the control of their properties.
✓ This phase diagram is constructed by plotting the carbon composition (weight per cent) along the X-axis and temperature along the Y-axis.
✓ The iron-iron carbide (Fe-Fe3C) phase diagram is shown in Fig. 1.25.
✓ This phase diagram presents the phases present at various ating temperatures for very slowly cooled iron-carbon alloys with upto 6.67% carbon↑.
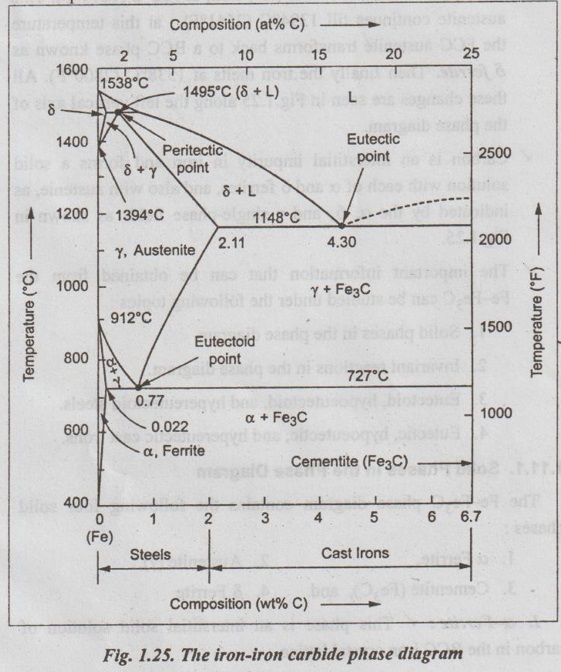
● It may be noted that the composition axis in Fig. 1.25 extends only upto 6.67 wt % C. This is because in practice, all steels and cast irons have carbon contents less than 6.67 wt % C.
✓ As discussed in Section 1.9.2, the pure iron exists in three allotropic forms i.e., α iron, γ iron, and δ iron before it melts. ups At room temperature the stable form, called ferrite (or α iron), exist with a BCC crystal structure. Upon heating, ferrite transforms to FCC austenite (or γ iron) at 912°C (1674°F). This austenite continues till 1394°C (2541°F); at this temperature the FCC austenite transforms back to a BCC phase known as δ ferrite. Then finally the iron melts at 1538°C (2800°F). All these changes are seen in Fig.1.25 along the left vertical axis of the phase diagram.
✓ Carbon is an interstitial impurity in iron and forms a solid solution with each of α and δ ferrites, and also with austenie, as indicated by the α ,δ, and γ single-phase fields as shown in Fig.1.25.
✓ The important information that can be obtained from the Fe-Fe3C can be studied under the following topics:
1. Solid phases in the phase diagram.
2. Invariant reactions in the phase diagram.
3. Eutectoid, hypoeutectoid, and hypereutectoid steels.
4. Eutectic, hypoeutectic, and hypereutectic cast irons.
1. Solid Phases in the Phase Diagram
The Fe-Fe3C phase diagram contains the following four solid phases:
1. α Ferrite,
2. Austenite (γ),
3. Cementite (Fe3C), and
4. δ Ferrite
1. α-Ferrite:
✓ This phase is an interstitial solid solution of carbon in the BCC iron crystal lattice.
✓ As shown in Fig.1.25, the solid solubility of carbon in a ferrite is a maximum of 0.02% at 723°C and decreases to 0.005% at 0°C.
2. Austenite (or γ iron):
✓ The interstitial solid solution of carbon in γ iron is called austenite.
✓ Austenite has an FCC crystal structure and a much higher solid solubility for carbon than α ferrite.
✓ As indicated by Fig.1.25, the solid solubility of carbon in austenite is a maximum of 2.08% at 1148°C and decreases to 0.8% at 723°C.
3. Cementite (Fe3C):
✓ The intermetallic iron-carbon compound (Fe3C) is called cementite.
✓ As shown in Fig. 1.25, cementite has negligible solubility limits and a composition of 6.67% C and 93.3% Fe.
4. δ Ferrite:
✓ The interstitial solid solution of carbon in δ iron is called & ferrite.
✓ δ ferrite has a BCC crystal structure.
✓ As shown in Fig. 1.25, the maximum solid solubility of carbon in δ ferrite is 0.09% at 1465°C.
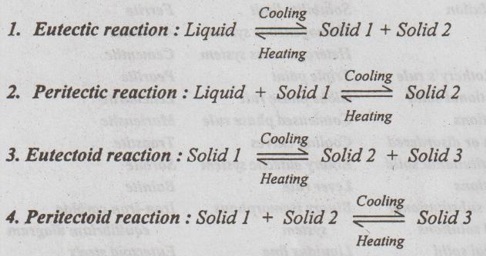
2. Invariant Reactions in the Fe-Fe3C Phase Diagram
The three important invariant reactions associated with the Fe- Fe3C diagram are peritectic, eutectic, and eutectoid reactions.
1. Peritectic reaction
✓ At this peritectic reaction point (shown in Fig.1.25), liquid of 0.53% C combines with δ ferrite of 0.09% C to form γ austenite of 0.17% C.
✓ This pertectic reaction, which occurs at 1495°C, can be written as
✓ The peritectic reaction affects only solidification of steels with less than 0.55% carbon.
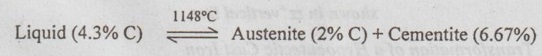
2. Eutectic reaction
✓ At the eutectic reaction point (shown in Fig.1.25), liquid of bilo 4.3% forms γ austenite of 2.08% C and the intermetallic compound Fe3C (cementite), which contains 6.67% C.
✓ This eutectic reaction, which occurs at 1148°C, can be written as
✓ This reaction is of great importance in cast irons.
3. Eutectoid reaction
✓ At the eutectoid reaction point (shown in Fig.1.25), solid austenite of 0.8% C produces α ferrite with 0.02% C and Fe3C that contains 6.67% C.
✓ This eutectoid reaction, which occurs at 723°C, can be written as

✓ This reaction gains much importance for the heat treatment of steels.
3. Solidification of Iron-Carbon Alloys
(Eutectoid, hypoeutectoid, and hypereutectoid steels)
✓ As we know, there are three types of ferrous alloys based on carbon content. They are: 1. Iron, 2. Steel, and 3. Cast iron.
✓ Composition upto 0.008% carbon are regarded as commercially pure iron, those from 0.008 to 2% carbon represent steel, and those above 2% carbon represent cast iron.
✓ Steels are further subdivided into :
1. Eutectoid steels: Steels that contain 0.8% C (the eutectoid amount of carbon) are called eutectoid steels.
2. Hypoeutectoid steels: Steels having less than 0.8%C are known as hypoeutectoid steels.
3. Hypereutectoid steels: Steels having more than 0.8% C are known as hypereutectoid steels.
1. Transformation of a Eutectoid Steel
✓ If a sample of a 0.8% (eutectoid) steel is heated to about 750°C and held for a sufficient time, its structure will become homogeneous austenite. This process is called austenitizing.
✓ Fig.1.26 illustrates the transformation of a eutectoid steel Sif(0.8% C) with slow cooling.
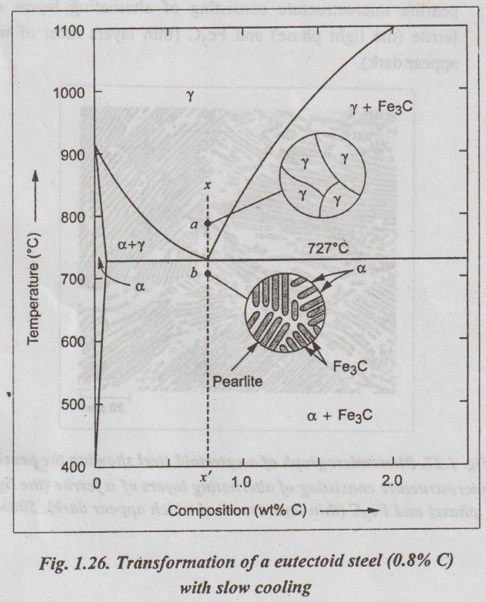
✓ Now the heated eutectoid steel is cooled very slowly to just above the eutectoid temperature. Then its structure will remain austenitic, as shown in Fig.1.26, at point 'a'.
✓ On further cooling upto the eutectoid temperature or just below it, will cause the entire structure to transform from austenite to a lamellar structure of alternate plates of α ferrite and cementite (Fe3C).
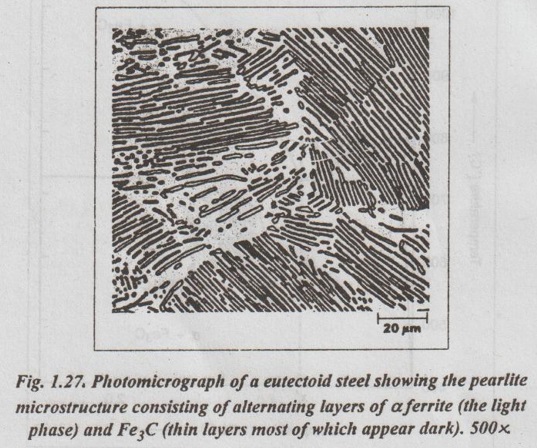
✓ Just below the eutectoid temperature, at point 'b' in Fig.1.26, the lamellar structure called pearlite appear.
✓ Fig. 1.27 is a photomicrograph of a eutectoid steel showing the pearlite microstructure consisting of alternating layers of α ferrite (the light phase) and Fe3C (thin layers most of which appear dark).
2. Transformation of a Hypoeutectoid Steel
✓ Now consider a composition C0 to the left of he eutectoid, between 0.022% and 0.8% C. This is termed a hypoeutectoid (less than eutectoid) steel.
✓ Fig.1.28 illustrates the transformation of a 0.38% C hypoeutectoid steel with slow cooling.
✓ If a sample of a 0.38% C steel (hypoeutectoid steel) is heated to about 875°C (point a in Fig.1.28) for a sufficient time, its microstructure will become homogeneous austenite.
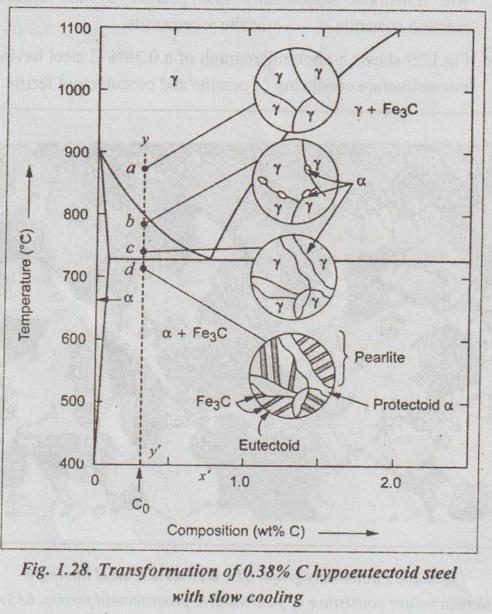
✓ Then if this steel is slowly cooled to temperature b in Fig.1.28 (about 775°C), proeutectoid (meaning pre- or before eutectoid). ferrite will nucleate and grow mostly at the austenite grain bosboundaries.
✓ If this alloy is slowly cooled from temperature b to c in Fig.1.28, the amount of proeutectoid ferrite formed will continue to increase until about 50% of the austenite is of hole transformed.
✓ On further slow cooling upto 723°C, the remaining austenite will transform isothermally into pearlite by the eutectoid reaction austenite → ferrite + cementite.
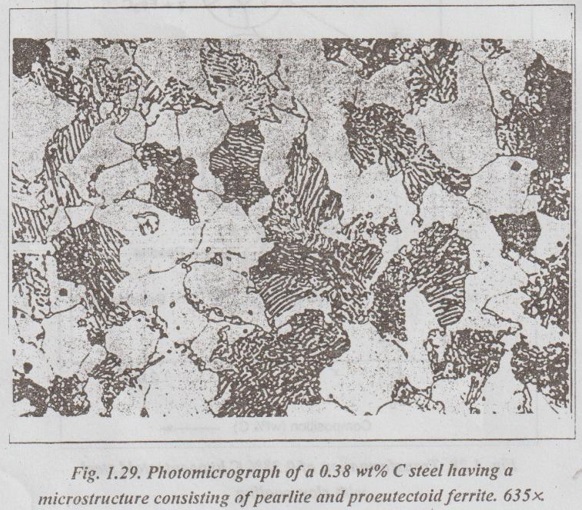
✓ Fig.1.29 shows a photomicrograph of a 0.38% C steel having a microstructure consisting of pearlite and proeutectoid ferrite.
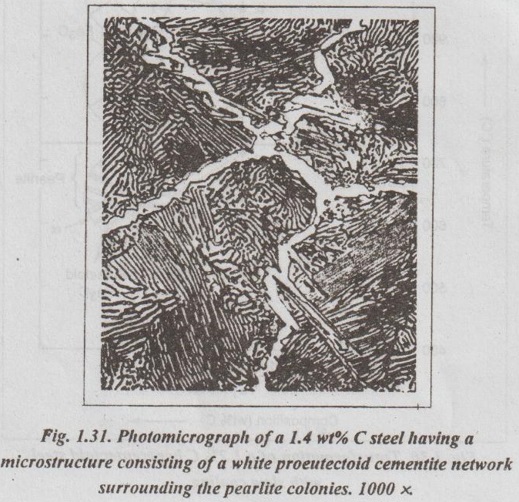
3. Transformation of a Hypereutectoid Steels
✓ Now let us consider a composition C1 to the right of the eutectoid between 0.8% and 2.11% C. This is termed a hypereutectoid (more than eutectoid) steel.
✓ Fig.1.30 illustrates the transformation of a 1.2% C hyper- eutectoid steel with slow cooling.
✓ If a sample of a 1.2% C steel (hypereutectoid steel) is heated to about 925°C and held for a sufficient time, it will become all austenite (point a in Fig.1.30).
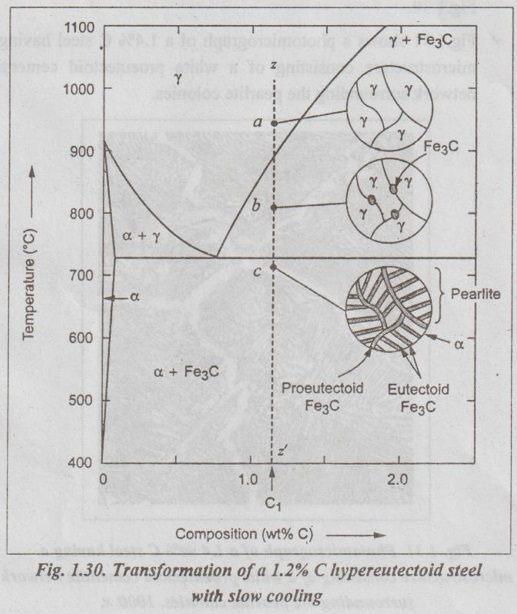
✓ If this steel is cooled very slowly to temperature b in Fig.1.30, then proeutectoid cementite will begin to nucleate and grow primarily at the austenite grain boundaries.
✔ On further cooling upto point c in Fig. 1.30, which is just about 723°C, more proeutectoid cementite will be formed at the austenite grain boundaries.
✓ With still further slow cooling to 723°C or just slightly below this temperature, the remaining austenite will transform to pearlite by the eutectoid reaction, as indicated at point c in Fig. 1.30.
✓ Fig.1.31 shows a photomicrograph of a 1.4% C steel having a microstructure consisting of a white proeutectoid cementite network surrounding the pearlite colonies.
4. Transformations which take place in the structure of a cast iron
(Eutectic, hypoeutectic, and hypereutectic cast irons)
As we know, composition above 2% carbon are known as cast irons. Like steels, cast irons can also be subdivided into :
1. Eutectic cast irons: Cast irons that contain 4.3% C (i.e., the eutectic amount of carbon) are called eutectic cast irons.
2. Hypoeutectic cast irons: Cast irons having less than 4.3% C are known as hypoeutectic cast irons.
3. Hypereutectic cast iron: Cast irons having more than 4.3% C are known as hypereutectic cast irons.
1. Transformation of a Eutectic Cast Iron
✓ If a sample of 4.3% (eutectic) cast iron is heated to about 1175°C (point a in vertical line xx' in Fig. 1.32) for a sufficient time, its structure will homogeneous liquid iron.
✓ If this eutectic cast iron is cooled very slowly just to the eutectic temperature (1148°C), then the eutectic reaction takes place with the simultaneous precipitation of austenite of cementite. This mixture of austenite and cementite is called ledeburite (point b in Fig.).
✓ Thus the eutectic reaction, which occurs at 1148°C can be written as
✓ Therefore, just below eutectic temperature, the cast iron consists of austenite crystals and ledeburite.
✓ Cooling of the alloy below 723°C (point C in Fig.1.32) transforms austenite of eutectoid composition to pearlite.
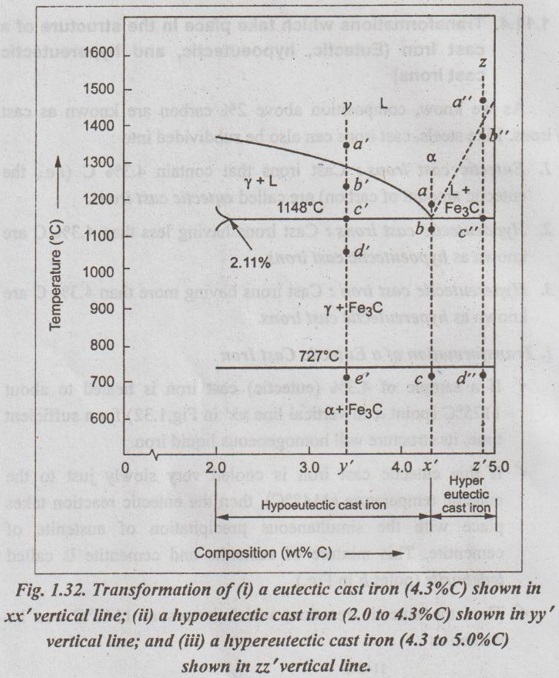
2. Transformation of a Hypoeutectic Cast Iron
✓ If a sample of a 3.4% C cast-iron (hypoeutectic cast iron) is heated to about 1350°C (point a' in vertical line yy' in Fig.1.32) for a sufficient time, its structure will become homogeneous liquiduetal.
✓ Then if this cast iron is slowly cooled to temperature b' in Fig.1.32 (about 1250°C), the alloy of liquid metal and austenite crystals will form. On further cooling, more and more austenite precipitates out of the liquid.
✓ At a temperature of 1148°C (point c' in Fig.1.32), the alloy consists of 50% austenite and 50% liquid of eutectic composition (i.e., austenite and cementite).
✓ As the alloy cools below 1148°C (point d' in Fig.1.32), ledeburite (a form of eutectic consisting of austenite and cementite) freezes and cementite precipitates. This occurs between temperatures 1148°C and 723°C.
✓ Cooling of the alloy below 723°C (point e' in Fig.1.32) 92nd involves the transformation of remaining austenite of eutectoid composition to pearlite, as discussed earlier for steels in Section 1.11.3.
✓ Thus the structure of alloy at room temperature consists of cementite, pearlite, and transformed ledeburite.
✓ The above phase transformation can be seen for any composition of cast iron between 2.0 to 4.3% carbon.
3. Transformation of Hypereutectic Cast Iron
✓ If a sample of a 4.8% (cast iron) (hypereutectic cast iron) is heated to about 1450°C (point a" in vertical line zz' in Fig.1.32) for a sufficient time, its structure will become homogeneous liquid metal.
✓ Then if this cast iron is cooled very slowly to temperature b" in Fig. 1.32, cementite crystals nucleate and grow in the liquid phase.
✓ With further slow cooling to point c" of Fig. 1.32, at 1148°C, eutectic reaction takes place with the formation of ledeburite. Thus the completely solidified hypereutectic cast iron consists of cementite and ledeburite.
✓ As usual, cooling this alloy below 723°C (point d" in Fig.1.32), results in the formation of pearlite.
✓ The above phase transformation can be seen for any composition of cast iron between 4.3 to 5% carbon.
REVIEW AND SUMMARY
✔ All solid materials contain large numbers of impurities (or imperfections) or deviations from crystalline perfection.
✔ An alloy is a mixture of two or more metals or a metal (metals) and a non-metal (non-metals).
✔ The element which is present in the largest proportion is called the base metal, and all other elements present are called alloying elements.
✔ A solid solution may be defined as a solid that consists of two or more elements atomically dispersed in a single-phase structure.
✔ A solute is the minor part of the solution or the material which is dissolved.
✔ Solvent is the one which constitutes the major portion of the solution.
✔ The amount of alloying element that one can add to produce solid solution is limited by the solubility of the alloying element in the host material.
✔ The solid solubility is limited (Hume Rothery's Rule) when:
(1) the atomic difference is more than about 15%;
(2) the alloying element has a different crystal structure than the host element; and
(3) the valence and electronegativity of the alloying element are different from the host element.
✔ Types of solid solutions:
1. Substitutional solid solutions
(a) Random, and (b) Ordered
2. Interstitial solid solutions.
✔ When the solute atoms (impurities) substitute for parent solvent atoms in a crystal lattice, they are called substitutional atoms, and the mixture of the two elements is called a substitutional solid solution.
✔ In random substitutional solid solution, there is no order in the substitution of the two elements; the solute and solvent atoms are randomly distributed.
✔ If the solute and solvent atoms take up some preferred position, then the solution is called ordered substitutional solid solution. or super lattice.
✔ In interstitial solid solution, the solute atoms fit into the space between the solvent or parent atoms. These spaces or voids are called interstices.
✔ The compounds formed by two or more metals in an apparently stoichiometric proportion is called intermetallic compounds.
✔ Interstitial compounds, are a special case of intermetallic compounds, form between transition elements upon exceeding the solubility limit of the interstitial element.
✔ Intermediate phases which tend to obey valence laws are known as valency compounds.
✔ If two metals consist of atoms of more or less similar size but different valency, then the compounds formed are called electron compounds.
✔ Phase diagrams are graphical representations of what phases are present in an alloy system at various temperatures, pressures, and compositions.
✔ In this unit, temperature composition binary equilibrium phase diagrams are emphasised in more detail.
✔ A phase is defined as any physically distinct, homogeneous, and mechanically separable portion of a substance.
✔ A single-phase system is also termed as homogeneous system. Systems composed of two or more phases are termed as mixtures or heterogeneous systems.
✔ In a phase diagram, a triple point is the point at which three phases (solid, liquid, and vapour phases) of a single material coexist.
✔ The Gibbs phase rule is a simple equation that relates the number of phases present (P) in a system at equilibrium with the number of degrees of freedom (F), the number of compo- nents (C), and the number of non-compositional variables.
Gibbs phase rule: F = C - P + 2
✔ When the pressure variable is kept constant at 1 atmosphere, then the condensed Gibbs phase rule is given by
F = C - P + 1
✔ Cooling curves are obtained by plotting the measured tempe- ratures at equal intervals during the cooling period of a melt to a solid.
✔ Using the phase diagram, one can obtain the following three important informations:
1. The phases that are present: The phase diagram tells us which phases are present at different compositions and temperatures for slow cooling or heating conditions that approach equilibrium.
2. The composition of each phase: In two-phase regions of the phase diagrams, the chemical compositions of each of the two phases is indicated by the intersection of the isotherm with the phase boundaries.
3. The amount of each phase present: The weight fraction or percentage weight of each phase in a two-phase region can be determined by using the Lever rule along an isotherm (tie line at a particular temperature).
✔ In binary equilibrium isomorphous phase diagrams, the two components are completely soluble in each other in the solid state, and so there is only one solid phase.
✔ In binary equilibrium alloy phase diagrams, invariant reactions involving three phases in equilibrium often occur.
✔ The most common invariant reactions are:
✔ The pure iron exists in three allotropic forms such as α iron, γ iron, and δ iron.
✔ The various micro-constituents of iron-carbon alloys are:
1. Ferrite (or α iron),
2. Austenite (or γ iron),
3. Cementite (or Fe3C),
4. Pearlite,
5. Ledeburite,
6. Martensite,
7. Troostite,
8. Sorbite, and
9. Bainite.
✔ Iron-iron carbon equilibrium diagram is constructed by plotting the carbon composition (weight percent) along the X- axis and temperature along the Y-axis.
✔ At the end of this unit, the iron-iron carbon equilibrium phase diagram and the development of microstructure in iron-carbon alloys have been discussed in detail.
No comments:
Post a Comment