The data for the construction of TTT diagrams are obtained from the isothermal transformation of austenite at differing temperatures.
CONTINUOUS-COOLING TRANSFORMATION (OR CCT) DIAGRAMS
1. Introduction
The data for the construction of TTT diagrams are obtained from the isothermal transformation of austenite at differing temperatures. But most industrial heat treatments involve continuous cooling from the austenitic temperature to room temperature. Thus a TTT diagram may not give a fully accurate representation of the temperatures and times of the transformations occurring. The continuous cooling diagram (CCT diagram) gives a more accurate picture for heat treatments involving continuous cooling.
The CCT diagram is a plot of temperature versus the logarithm of time for a steel alloy of definite composition. It is used to indicate. when transformations occur as the initially austenitised material is continuously cooled at a specified rate. In addition, it is also used to predict the final microstructure and mechanical characteristics.
2. CCT Diagram for a Eutectoid Carbon Steel
✓ We know that an isothermal transformation diagram (i.e., TTT Sed diagram) is valid only for conditions of constant temperature. Since the continuous cooling is the most practical method of heat treatment, therefore the TTT diagram must be modified for transformations that occur as the temperature is constantly changing.
✓ For continuous cooling, the time required for a reaction to begin and end is delayed. Thus the isothermal curves are shifted to longer times and lower temperatures. A plot containing such modified beginning and ending reaction curves is termed a continuous cooling transformation (CCT) diagram.
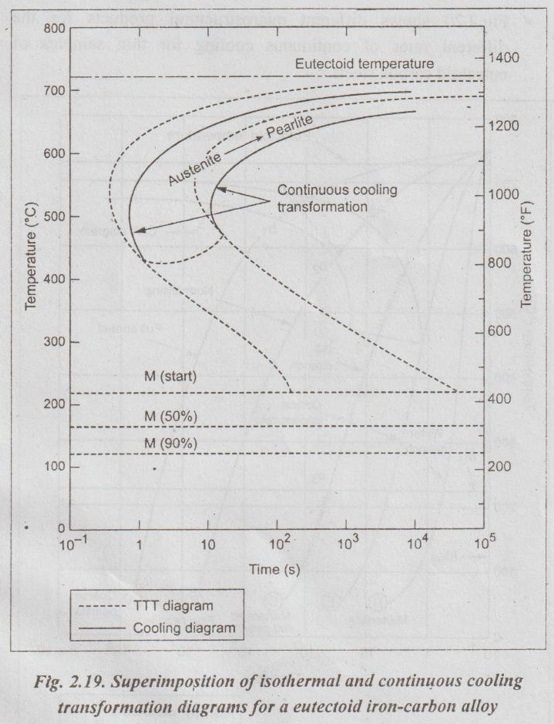
✓ Fig.2.19 shows a CCT diagram for a eutectoid carbon steel superimposed over a TTT diagram for that steel.
✓ In Fig.2.19, the continuous-cooling diagram transformation start and finish lines are shifted to longer times and slightly lower temperatures in relation to the isothermal diagram. Also there are no transformation lines below about 450°C for the austenite-to-bainite transformation.
✓ Intersection of the cooling curve with the beginning TTT curve indicates the start of transformation. Time at temperature, in proportion to the time required for complete transformation, indicates the degree to which transformation has progressed.
3. Effect of Cooling Rate in torms of TTT Curves
✓ As we know, the entire process of heat treatment of steel is governed by the rate of cooling of austenite into different micro-constituents.
✓ Fig.2.20 shows different microstructural products for the different rates of continuous cooling for thin samples of eutectoid carbon steels.
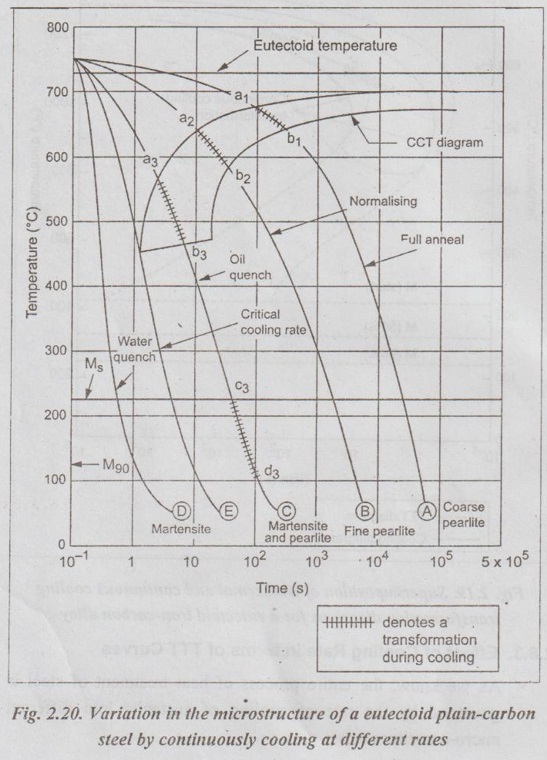
1. Cooling curve A: Curve A represents a very slow cooling rate such as in annealing. This cooling rate allows transformation to pearlite to start at a1 and complete at b1.
2. Cooling curve B: Curve B represents more rapid cooling (as in normalising). This transformation will start at a2 with the formation of coarse pearlite and finish at b2 with the formation of fine pearlite.
3. Cooling curve C: In curve C, the transformation to pearlite begins at a3 but is interrupted at b3; and no further transformation takes place until the remaining austenite begins to change to martensite (at c3). This final transformation being complete at d3. Thus the resulting structure is a mixture of martensite and pearlite. Since the transformation takes place in two steps, it is called a split transformation.
4. Cooling curve D: Curve D represents very rapid cooling. It avoids the formation of ferrite, cementite, pearlite, or bainite. This might be a water quench to produce martensite.
5. Cooling curve E: Curve E is tangent to the nose of CCT curve. The curve E represents critical cooling rate, which will produce a fully hardened (i.e., 100%) martensitic structure.
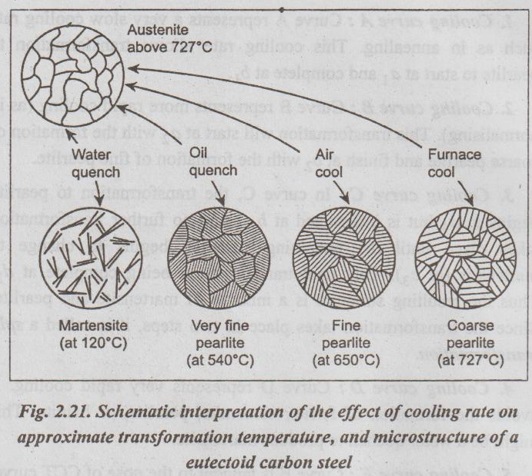
✓ Fig.2.21 shows the schematic interpretation of the effect of cooling rate on approximate transformation temperature, and microstructure of a eutectoid carbon.
Remarks: From the above discussion, we can have the following two points:
1. With continuous cooling of plain carbon steels, one can produce only pearlite, martensite, or a mixture of the two.
2. There is no mechanism by which pearlite can be transformed into martensite or martensite into pearlite without first reheating above the upper critical temperature to austenitize.
4. Critical Cooling Rate
✓ Definition: The slowest rate of cooling of austenite that will result in 100% martensite transformation is known as the critical cooling rate.
✓ Importance: The critical cooling rate is most important in gniwo hardening. In order to obtain a 100% martensitic structure on hardening, the cooling must be much higher than the critical cooling rate.
✓ Factors affecting the critical cooling rate are:
1. Chemical composition of steel,
2. Hardening temperature, and
3. Metallurgical nature (i.e., purity) of steel.
No comments:
Post a Comment