A state of system is represented by selecting the properties i.e. temperature (T) and entropy (s) as co-ordinates as shown in Figure 2.33.
T-s DIAGRAM
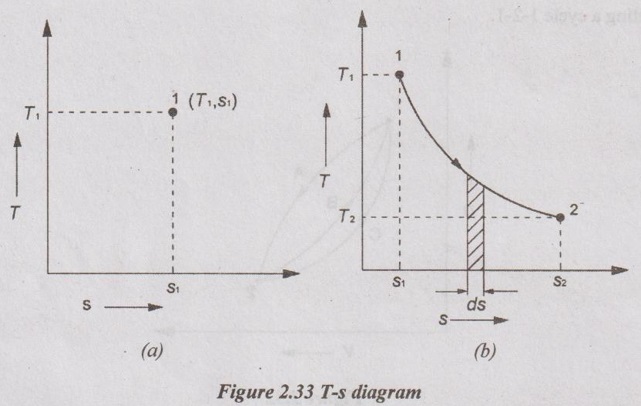
A state of system is represented by selecting the properties i.e. temperature (T) and entropy (s) as co-ordinates as shown in Figure 2.33. This diagram is known as T-s diagram.
The differential form of heat transfer can be written as
dQ = Tds
When a system undergoes a change of states from state 1 to state 2, then the area under the process 1-2 represents the heat transfer from state 1 to state 2 as shown in Figure 2.33.
Integrating above equation for state 1 to state 2,

The quantity of heat transfer (Q1-2)rev is represented by the area under T-s diagram (i.e. area 1-2-s2-s1-1).
No comments:
Post a Comment