Characteristics curves of a hydraulic turbines are the curves, with the help of which the exact behavior and performance of the turbine under different working condition can be known.
CHARACTERISTIC CURVES OF HYDRAULIC TURBINES
Characteristics curves of a hydraulic turbines are the curves, with the help of which the exact behavior and performance of the turbine under different working condition can be known. These curves are plotted from the result of the tests performed on the turbine under different working conditions.
The important parameter which are varied during a test on a turbines.
1. Speed (N)
2. Head (H)
3. Discharge (Q)
4. Power (P)
5. Overall efficiency (η0) and
6. Gate opening
Out of the above six parameters, three parameters namly speed (N), head (H) and discharge (Q) are independent parameters. Out of the three independent parameter, (N, H, Q) one of the parameter is kept constant (say H) and the variation of the other four parameters with respect to any one of the remaining two independent variables (N&Q) are plotted and various curves are obtained. These curves are called characteristic curves.
The following are the important characteristic curves of turbine
(i) Main characteristic curves or constant heard curves
(ii) Operating characteristic curves or constant speed curves
(iii) Muschel curves or constant Efficiency curves.
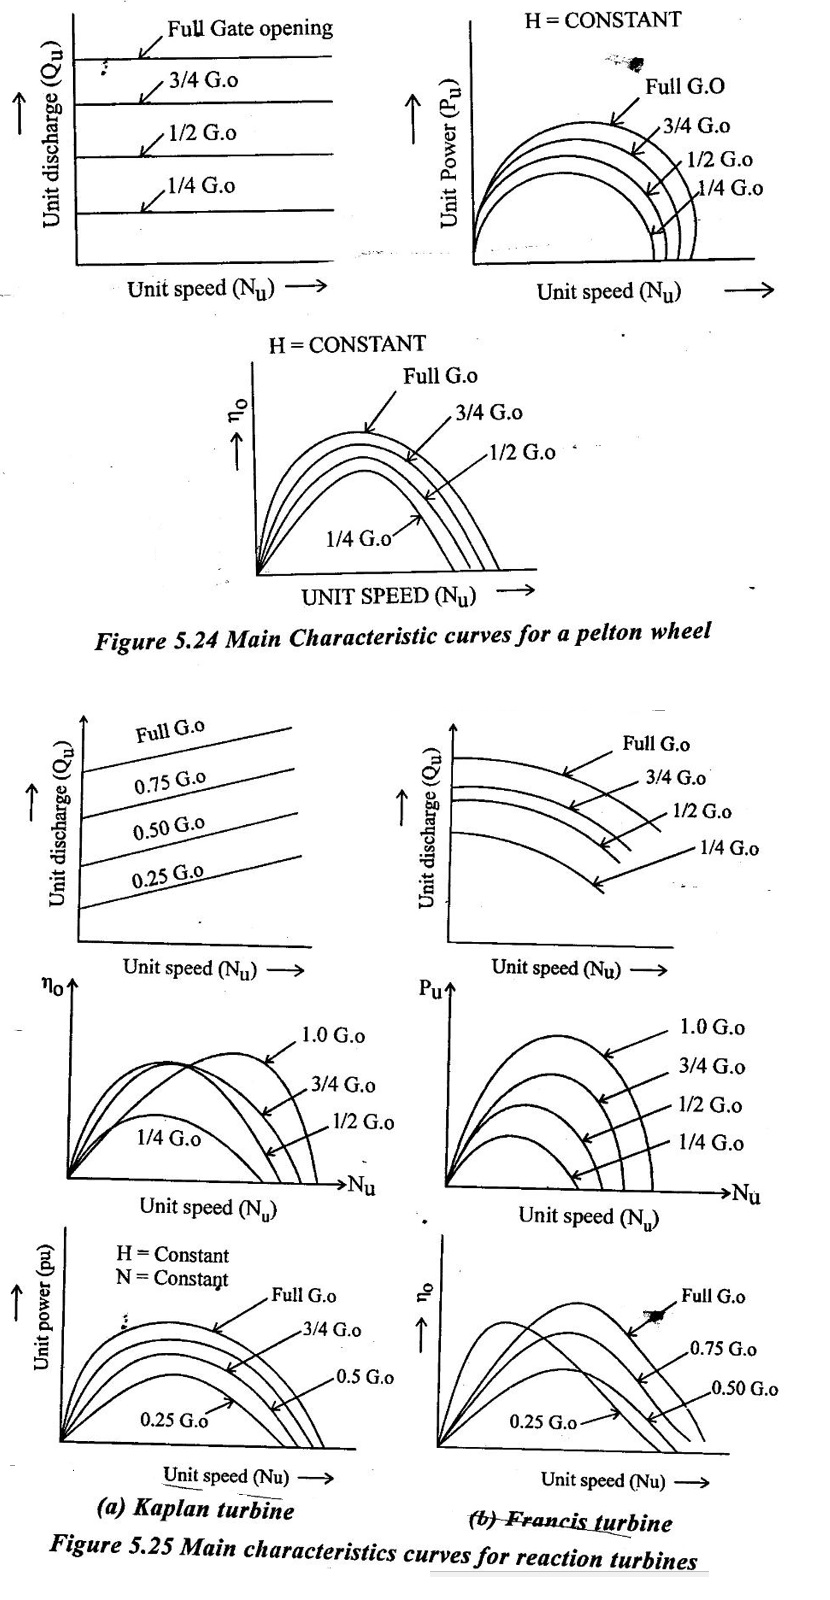
1. Main Characteristics curves or constant Head curves
It obtained by maintaining a constnat head and a constant gate opening (G.O) on the turbine. The speed of the turbine is varied by charging load on the turbine. For each value of the speed, the corresponding values of the power (P) and discharge (Q) are obtained. Then the overall efficiency (η0) for each value of the speed is calculated. From these reading the values of unit speed (Nu), unit power (Pu) and unit discharge (Qu) are determined. Taking Nu as abscissa, The values Qu, Pu, P and η0 are plotted as shown in figs 5.24 and 5.25. By changing the gate opening, the values of Qu, Pu and η0 and Nu are determined and taking Nu as abscissa, the values of Qu, Pu and η0 are plotted, fig 5.24 shows the main characteristic curves for pelton wheel and fig 5.25 shows the main characterstic curves for reaction (Francis & kaplan) turbine.
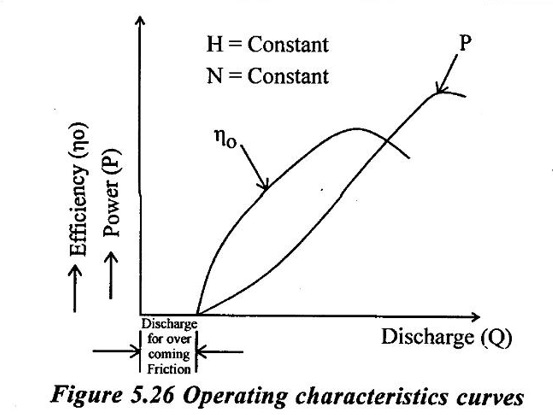
2. Operaing Characteristics curves or constant speed curves
Operating characteristics curves are plotted when the speed on the turbine is constant. In case of turbines, the head is generally constant. Already mentioned are three independent parameter namely N, H and Q. For operting characteristics N and H are constant and hence the varation of power and efficiency with respect to discharge Q are plotted. The power curve for turbine shall not pass through the origin because certain amount of discharge is needed to produce power to overcome initial friction. Hence the power and efficiency curve will be slighty away from the origin on the x-axis, as to overcome initial friction certain amount of discharge will be required. Fig 5.26 Show the variation of power & efficiency with respect of discharge
3. Constant Efficiency Curves or Muschel Curves or ISO - Efficiency curves
These curves are obtained from the speed Vs effiency of speed Vs discharge for different gate openings for a given efficiency from the Nu Vs η0 curves, there are two speeds. From the Nu Vs Qu curves, corresponding two values of speed there are two values of discharge. Hence for a given efficiency there are two values of discharge for a particular gate opening.
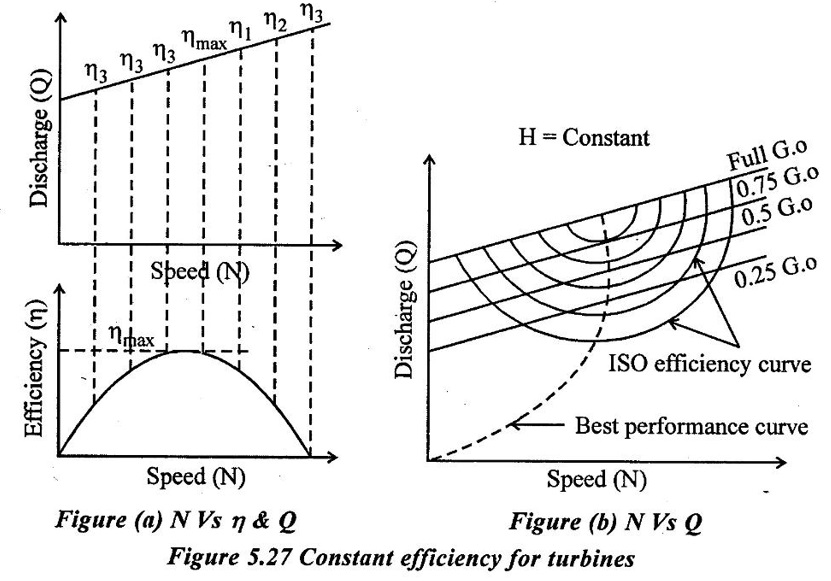
This means for a given efficiency there are two values of speeds and two values of the discharge for a given gate opening. If the efficiency is maximum. There is only one value of discharge corresponding to a particular gate opening are plotted as shown in figure 5.27(b). The procedure is repeated for different gate openings and the curve Q vs N are plotted. The points having the same efficiency are joined the curves have same efficiency curves. These curves are helpful for determing the zone of constant efficiency and for predicating the performance for turbine of various efficiencies.
For plotting the iso-efficiency curves, horizontal lines representing the same efficiency are drown on the no vs speed curves. The points at which these lines cut the efficiency curves at various gate openings are transferred to the corresponding Q vs speed curves. The points having the same efficiency are then joined by a smooth curnes. These smooth curves represents the iso- efficiency curve.
No comments:
Post a Comment